Yuichiro Chino/Moment via Getty Images
The S&P 500 (SPY) blew off to new all-time highs this week, mirroring the projections outlined in last weekend’s article. Not only did the index “take a step back on Tuesday’s re-open and drop to test the 4950-60 area,” it then rebounded to the target area at “the cluster of Fibonacci measurements in the 5107-112 area” and reversed at 5111 on Friday.
Granted, I thought the rally would be a lot slower, but I doubt anyone is disappointed when profits are made faster than anticipated.
This weekend’s article will focus on what to expect now the target has been reached. Various techniques will be applied to multiple timeframes in a top-down process which also considers the major market drivers. The aim is to provide an actionable guide with directional bias, important levels, and expectations for future price action.
S&P 500 Monthly
With only four sessions left in February, it seems unlikely a bearish bar will be formed with a close below the 4861 open. Even a close back inside January’s range below 4931 looks a tall order.
That’s not to say a reversal couldn’t start next week. The October bottom came from a neutral bar, while the July top came from a bullish bar. It just means we are unlikely to get a solid reversal signal from the monthly chart.
Weak seasonality in the second half of February is yet to transpire, but now the Fibonacci targets have been reached, the last four sessions could see a change.
SPX Monthly (Tradingview)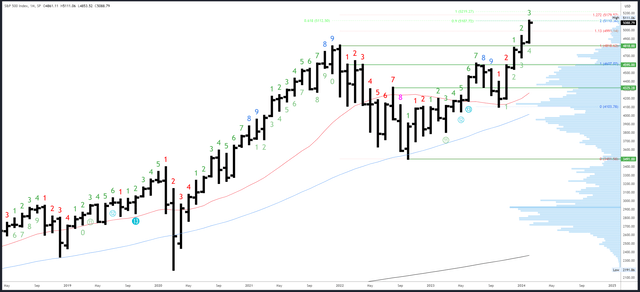
The rally stopped at 5111 on Friday which is right in the 5107-5112 range where three measured moves/Fibonacci targets are in confluence (the 2022-2024 rally equals 0.618* of the 2020-2021 rally at 5112, the 200% extension of the July-October correction is at 5110, while another measured move in the rally from the 2022 low comes in at 5107).
5179 is the next Fibonacci extension (127% extension of the 2021-2022 drop).
4931 is an important level on the downside. 4818 is the next major level at the previous all-time high.
There will be a long wait for the next monthly Demark signal. February is bar 3 (of a possible 9) in a new upside exhaustion count.
S&P 500 Weekly
A bullish weekly bar formed this week with a higher low, higher high and higher close. Six of the seven bars in the rally off the January low have the same characteristics.
Now the Fib targets have been reached and weekly exhaustion is registering, I will be looking for something different to form next week to signal a reversal. The key is for new lows of the week to be made on Thursday/Friday.
Worth noting is the rally has now exceeded the weekly channel – is this a breakout or is the rally getting ahead of itself? I suspect the latter, but we need to see at least another bar to know either way.
SPX Weekly (Tradingview)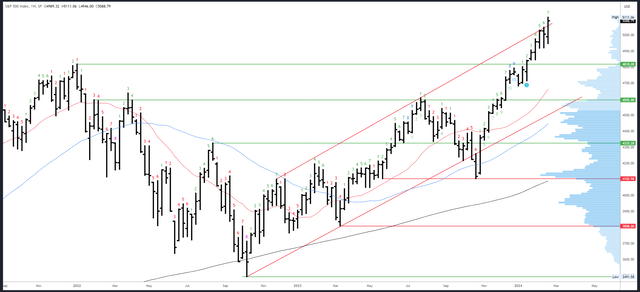
Now the channel has been broken, there is no resistance. The same Fib target of 5179 from the monthly chart is applicable.
The previous weekly highs of 5030-48 are key to momentum. Below there, this week’s low of 4946 is initial support, with the 4918-20 double bottom more important. The small weekly gap from 4842-44 is also potential support, but 4818 is the major level at the previous all-time high.
An upside Demark exhaustion count will be on bar 8 (of 9) next week. A reaction is usually seen on weeks 8 or 9 so we may finally get a change in character.
S&P 500 Daily
This week’s drop broke the channel but held the 20dma, which is exactly what was anticipated last week. A different channel can now be drawn which is more relevant to the latest swings.
Friday’s small dip looks more like profit taking than a bearish reversal. There is no strong bias for the beginning of next week.
SPX Daily (Tradingview)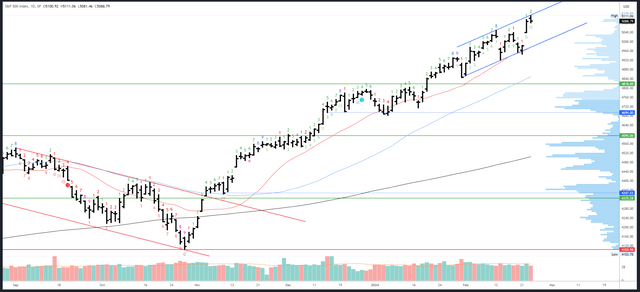
The only resistance comes from the new channel high which will be around 5122 on Monday.
The first support is Thursday’s low of 5038 which is in a key zone due to the previous weekly highs in the area. Channel support will be around 4980 on Monday and is in confluence with the 20dma.
A daily Demark exhaustion cannot complete next week.
Drivers/Events
Obviously, Nvidia (NVDA) earnings were the big talking point this week. I did see some mainstream media headlines on the rally (all-time highs in US, Germany, and Japan for the first time since the 1980s), which is a warning sign sentiment is getting frothy. Notably, Thursday’s blow off move saw some weak internals with only around 54% of the NYSE stocks rising.
Data this week was balanced – Manufacturing PMI beat and Services PMI missed, but both were in expansion territory. Overall, the economy remains stable despite the restrictive Fed policy. This suggests the Fed might have less influence than first assumed, at least in this part of the cycle. All is OK now, but if the economy does roll over, cuts are not likely to be the instant cure the market expects.
Next week is on the quiet side for scheduled releases. Prelim GDP is due on Wednesday and expected to show 3.3% growth. Core PCE Price Index m/m is released on Thursday alongside Unemployment Claims.
Probable Moves Next Week(s)
This week’s strong action came with some red flags. Weak participation on Thursday’s rally was accompanied by euphoric headlines. Furthermore, the rally stopped exactly in the expected target area on Friday. With a weekly exhaustion signal coming into effect next week, there is a compelling window for a reversal.
Saying all that, the market has not yet shown any real evidence of weakness. For a reversal to develop, I’d look for a test higher early next week to be rejected and lead to a drop into new weekly lows on Thursday and Friday. In short, the opposite to what happened this week. 5030-5038 is the first support area and a weekly close below could signal the start of a large correction. A daily close below the channel and 20dma would be further confirmation of a turnaround.
Credit: Source link