
• bitcoinBitcoin(BTC)$77,844.001.58%
  • ethereumEthereum(ETH)$2,513.771.57%
  • tetherTether(USDT)$1.00-0.01%
  • binancecoinBNB(BNB)$721.990.96%
  • rippleXRP(XRP)$1.404.56%
  • usd-coinUSDC(USDC)$1.000.00%
  • solanaSolana(SOL)$101.772.06%
  • tronTRON(TRX)$0.340006-0.20%
  • Figure HelocFigure Heloc(FIGR_HELOC)$1.000.00%
  • zcashZcash(ZEC)$1,137.714.32%
  • HyperliquidHyperliquid(HYPE)$80.273.65%
  • dogecoinDogecoin(DOGE)$0.0843281.00%
  • RainRain(RAIN)$0.015110-1.63%
  • USDSUSDS(USDS)$1.00-0.01%
  • moneroMonero(XMR)$514.73-4.64%
  • whitebitWhiteBIT Coin(WBT)$80.631.46%
  • chainlinkChainlink(LINK)$11.400.87%
  • leo-tokenLEO Token(LEO)$8.96-1.03%
  • cardanoCardano(ADA)$0.2109303.25%
  • stellarStellar(XLM)$0.1917757.93%
  • Ethena USDeEthena USDe(USDE)$1.00-0.01%
  • daiDai(DAI)$1.000.01%
  • bitcoin-cashBitcoin Cash(BCH)$223.440.17%
  • USD1USD1(USD1)$1.000.00%
  • litecoinLitecoin(LTC)$53.760.18%
  • uniswapUniswap(UNI)$6.320.79%
  • CantonCanton(CC)$0.0960911.16%
  • the-open-networkGram (prev. Toncoin)(GRAM)$1.350.17%
  • hedera-hashgraphHedera(HBAR)$0.0768802.32%
  • Global DollarGlobal Dollar(USDG)$1.000.01%
  • avalanche-2Avalanche(AVAX)$7.391.02%
  • nearNEAR Protocol(NEAR)$2.414.80%
  • shiba-inuShiba Inu(SHIB)$0.0000051.06%
  • suiSui(SUI)$0.732.24%
  • crypto-com-chainCronos(CRO)$0.0590730.96%
  • paypal-usdPayPal USD(PYUSD)$1.000.00%
  • BlackRock USD Institutional Digital Liquidity FundBlackRock USD Institutional Digital Liquidity Fund(BUIDL)$1.000.00%
  • BittensorBittensor(TAO)$236.471.91%
  • tether-goldTether Gold(XAUT)$4,301.86-1.04%
  • Circle USYCCircle USYC(USYC)$1.140.00%
  • MemeCoreMemeCore(M)$1.11-3.57%
  • okbOKB(OKB)$114.140.68%
  • Ripple USDRipple USD(RLUSD)$1.000.00%
  • Ondo US Dollar YieldOndo US Dollar Yield(USDY)$1.150.09%
  • aaveAave(AAVE)$126.562.14%
  • AsterAster(ASTER)$0.701.61%
  • mantleMantle(MNT)$0.572.04%
  • pax-goldPAX Gold(PAXG)$4,303.86-1.08%
  • World Liberty FinancialWorld Liberty Financial(WLFI)$0.057330-0.56%
  • OndoOndo(ONDO)$0.3557593.54%
TradePoint.io
  • Main
  • AI & Technology
  • Stock Charts
  • Market & News
  • Business
  • Finance Tips
  • Trade Tube
  • Blog
  • Shop
No Result
View All Result
TradePoint.io
No Result
View All Result

S&P 500: Trillion-Dollar Liquidity Squeeze Set To Meet AI Mania (SP500)

June 7, 2023
in Market & News
Reading Time: 5 mins read
A A
S&P 500: Trillion-Dollar Liquidity Squeeze Set To Meet AI Mania (SP500)
ShareShareShareShareShare

Bet_Noire

YOU MAY ALSO LIKE

Trump $5k ‘dividend’ proposal may not be possible legally and financially

Trump says war with Iran will be over after midterm elections

I am bullish on US equities — and I am very happy to having been so since late 2022, first as a function of valuation, then as a function of AI speculation. Over the months, I expect the S&P 500 (SP500) will move gradually higher, to about ~4,500, a ~18x FWD P/E by year end. However, following the recent debt ceiling agreement, which has been signed into law on June 3rd, I must admit that the next few weeks/ months may be somewhat volatile as the AI mania is fighting a trillion-dollar liquidity drain. In other words, the long/-mid-term price appreciation could be interrupted by a short term ~5% drop.

The argument is quite simple: With the U.S. Treasury having been restricted to sell additional debt, the government was drawing down the Treasury General Account (TGA), which can be considered liquidity accreditive on a macro level, as the TGA balance fell by approximately $400 billion from February to mid-April (notably, equity markets appreciated in value during that time).

Now, however, the U.S. government is allowed to sell new liabilities, and concerns are arising regarding potential financial strains as the Treasury office will rush to replenish its cash reserves by issuing debt (while simplified, one may think of TGA draw down as quantitative easing, and build up as quantitative tightening). According to some analysts (JPMorgan, Deutsche Bank, Citigroup), it is expected that the Treasury may sell between $750-1,000 billion worth of bills over the next three to six months in order to restore a healthy balance at the Treasury General Account.

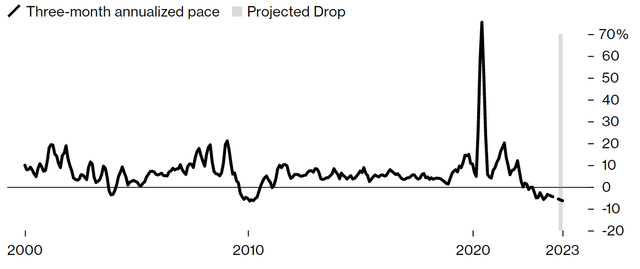
According to J.P. Morgan estimates, the TGA build-up may reduce the aggregate US money supply by about $1.1 trillion.

Money Supply in US over time

JPMorgan research; Bloomberg data mapping
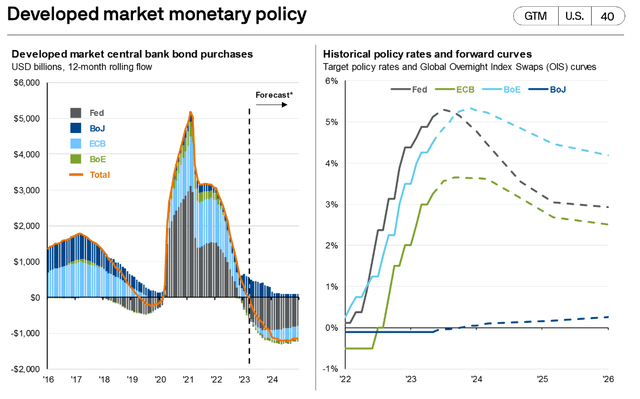
The event of the U.S. Treasury selling large amounts of debt is quite unique in recent history. Investors should consider that since the financial crisis, the Federal Reserve, and central banks across the western world, have bought more than 100% of the new debt issuance of governments. Since 2022, however, central banks have pushed quantitative tightening in an effort to wind down their balance sheets.

Quantitative Easing/ Tightening over time

JPMorgan Research

And with the largest net-buyer of government debt out of the game, who will step in to fill the void?

Countries like China and Japan have traditionally been major purchasers of US Treasuries, given their large foreign exchange reserves. But with the BoJ fighting currency depreciation, and China being rejected by politics, it is unlikely that support can be found in the east. And in general, the YTD dollar weakness may cause foreign investors to be somewhat more cautious in buying US dollar denominated financial assets.

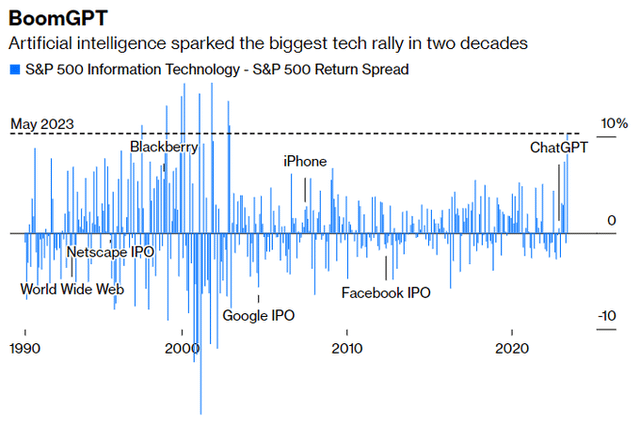
Meanwhile, BigTech — including names such as Nvidia (NVDA), Meta (META), Microsoft (MSFT), Apple (AAPL) and Google (GOOG) (GOOGL) — is soaking up capital on the backdrop of the AI speculation/ mania.

BigTech boom following ChatGPT mania

Bloomberg

To be fair, it is in my opinion unlikely that the AI rally will be starved of capital, because the decision to invest in Nvidia et al. is likely not (primarily) based on a rational capital allocation argument. Accordingly, I believe that the TGA-induced liquidity drain will likely pressure the stock prices of ‘value’ names such as Exxon Mobil (XOM) or AT&T (T), stocks who are currently not protected by any bullish glamour.

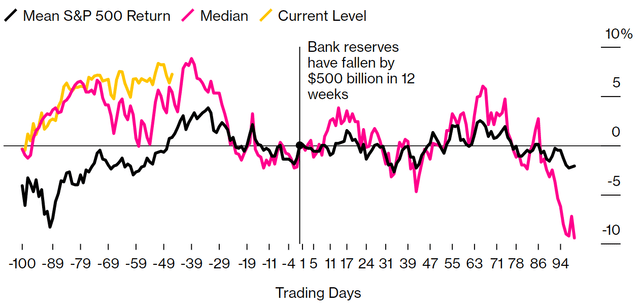
According to a research conclusion from Citigroup strategist Dirk Willer, the supply of new Treasuries will likely result in a ~5.5% drop for the S&P 500 over a two-months period. To arrive at this estimate, Citi modelled historical periods of an approximate $500 billion drop in money supply (taking bank reserves as a proxy) versus the S&P 500’s performance over the following twelve weeks.

S&P performance following bank reserves pressure

Citigroup Research

Interestingly, JPMorgan Chase & Co. strategist Nikolaos Panigirtzoglou, modelled a similar estimate, seeing a 5% decline in the S&P 500 as likely.

Concluding, the U.S. Treasury is expected to sell about $750-1,000 billion in the next three to six months (with the first sale scheduled for Monday 5th June), which could prompt a massive liquidity shock for markets in the short term — interrupting the long-/mid-term price appreciation of the equities market.

That said, I continue to be bullish on the S&P 500 through 2023. And I do not advise to sell stock based on the information and hypotheses presented in this article. However, if the S&P 500 indeed sells of by ~5% within the next few weeks, it might be very valuable to have the correct perspective on what is happening — likely only a break, not a reversal.

Credit: Source link

ShareTweetSendSharePin

Related Posts

Trump k ‘dividend’ proposal may not be possible legally and financially
Market & News

Trump $5k ‘dividend’ proposal may not be possible legally and financially

September 14, 2026
Trump says war with Iran will be over after midterm elections
Market & News

Trump says war with Iran will be over after midterm elections

September 14, 2026
Trump claims U.S. adults will get a k ‘dividend’ if Republicans win the midterms
Market & News

Trump claims U.S. adults will get a $5k ‘dividend’ if Republicans win the midterms

September 14, 2026
Trump says war with Iran will end after Election Day
Market & News

Trump says war with Iran will end after Election Day

September 14, 2026
Next Post
Bumble Will Give Employees Collective Time Off Every Year

Bumble Will Give Employees Collective Time Off Every Year

Leave a Reply Cancel reply

Your email address will not be published. Required fields are marked *

Search

No Result
View All Result
Amgen: Buy The Novartis-Driven Selloff (Rating Upgrade)

Amgen: Buy The Novartis-Driven Selloff (Rating Upgrade)

September 10, 2026
0,000 In Debt And Getting A Divorce

$130,000 In Debt And Getting A Divorce

September 9, 2026
Service in Shanksville remembers heroes of Flight 93

Service in Shanksville remembers heroes of Flight 93

September 13, 2026

About

Learn more

Our Services

Legal

Privacy Policy

Terms of Use

Bloggers

Learn more

Article Links

Contact

Advertise

Ask us anything

©2020- TradePoint.io - All rights reserved!

Tradepoint.io, being just a publishing and technology platform, is not a registered broker-dealer or investment adviser. So we do not provide investment advice. Rather, brokerage services are provided to clients of Tradepoint.io by independent SEC-registered broker-dealers and members of FINRA/SIPC. Every form of investing carries some risk and past performance is not a guarantee of future results. “Tradepoint.io“, “Instant Investing” and “My Trading Tools” are registered trademarks of Apperbuild, LLC.

This website is operated by Apperbuild, LLC. We have no link to any brokerage firm and we do not provide investment advice. Every information and resource we provide is solely for the education of our readers. © 2020 Apperbuild, LLC. All rights reserved.

No Result
View All Result
  • Main
  • AI & Technology
  • Stock Charts
  • Market & News
  • Business
  • Finance Tips
  • Trade Tube
  • Blog
  • Shop

© 2023 - TradePoint.io - All Rights Reserved!