

cemagraphics
This week’s action was challenging to navigate and to understand. The S&P500 (SPY) opened the week higher, then steadily dropped through support levels. With less than half an hour left until the monthly close, Friday’s session was trading at 5228, well inside the March/April range and shaping up to form bearish patterns on the weekly and daily charts. The similarities with the July ’23 top (as highlighted last week) were compelling. Then, out of nowhere, a spike higher of nearly 50 points flipped everything on its head.
It’s not as if erratic moves were unexpected. Two weeks ago I warned a simple bullish dip to 5264 followed by new highs may be “Too Easy.” When too many have the same view, the market tends to do something different, at least in the short-term. We can try to prepare for alternative scenarios – a more devious route – but I’m pretty sure most failed to anticipate the path which eventually unfolded. Friday’s move was so powerful as it finally looked like the bears would win.
That all said, we don’t always need to anticipate every wild swing and the bigger picture view can help keep us on the right side and avoid whipsaws. Last week’s article concluded, “Overall, the bullish signals are still intact and a strong close to May is probable.” Ignoring the noise, this played out. The higher timeframes are more reliable and this is why I use a top down method to analyse the technicals.
This week’s article will look at what Friday’s recovery means for the trend and for the week ahead. Various techniques will be applied to multiple timeframes in a top-down process which also considers the major market drivers. The aim is to provide an actionable guide with directional bias, important levels, and expectations for future price action.
S&P 500 Monthly
The May close of 5277 was above the March high of 5264 and May can now be chalked down as a bullish month. This gives the first part of June a bullish bias; new all-time highs above 5341 are likely.
SPX Monthly (Tradingview)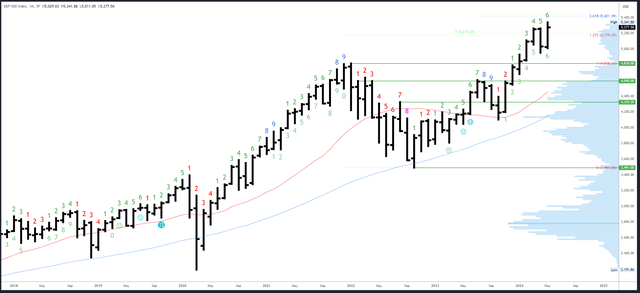
The May peak of 5341 is obvious resistance. Above that, measured moves and Fibonacci extensions will act as a guide for targets. The next of these is at 5421.
April’s low of 4953 is minor support. 4853 and 4818 are major levels below there.
June is bar 7 (of a possible 9) in an upside Demark exhaustion count. These counts can have an effect from bar 8 onwards so a possible reaction is getting closer.
S&P 500 Weekly
Following the previous week’s “doji”, a bearish close below 5257 would have formed a solid reversal pattern and this was all set up before the “save” into Friday’s close. It does pose the question of how much we can read into some moves – can a whole week’s worth of bearish action be negated by a 30-minute move? It depends. This is why I tend to look across multiple timeframes and multiple bars to make conclusions. One bar patterns can be unreliable.
Even with the late rally, a lower high, lower low and lower close were all made this week. Next week will be important in either negating the potential bearish pattern with the opposite characteristics, or confirming it should they repeat.
SPX Weekly (Tradingview)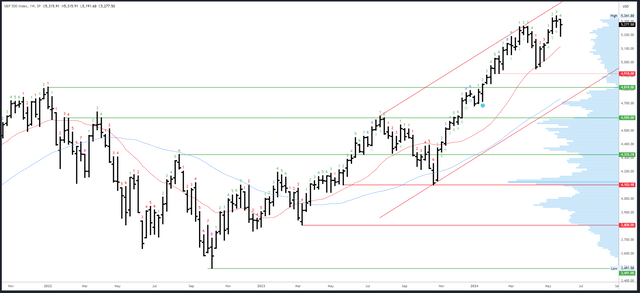
This week’s high of 5316 is minor resistance, with the 5341 peak just above. The weekly channel is at 5450 and too distant to be relevant.
This week’s low of 5192 is minor support, as is the gap at 5128-42. The 20-week MA is more important as it marked the April low, but is a distant 5130ish.
Next week will be bar 5 (of 9) of an upside Demark exhaustion count.
S&P 500 Daily
This week’s decline fell through 5257-64 support at the March high, through the channel and through the 20dma. The 50dma at 5181 would have been the next logical spot to test, so the reversal at 5191 was a difficult one to call. 5191 was the level of the 38% Fib retrace of the last rally, and the PPI spike low on 14th May, but the near miss of the 50dma was another challenging aspect of this week’s action.
SPX Daily (Tradingview)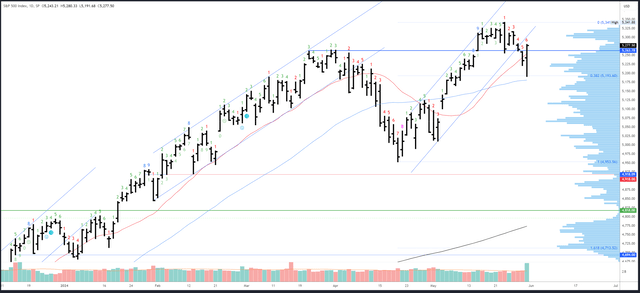
Last week’s article pointed out the similarities between current action and the July ’23 top as both periods formed an “engulfing” bar from a Thursday peak.
The similarities continued almost exactly until Friday’s reversal and recovery created a big divergence. Here’s an update –
July ’23 v Current (Tradingview)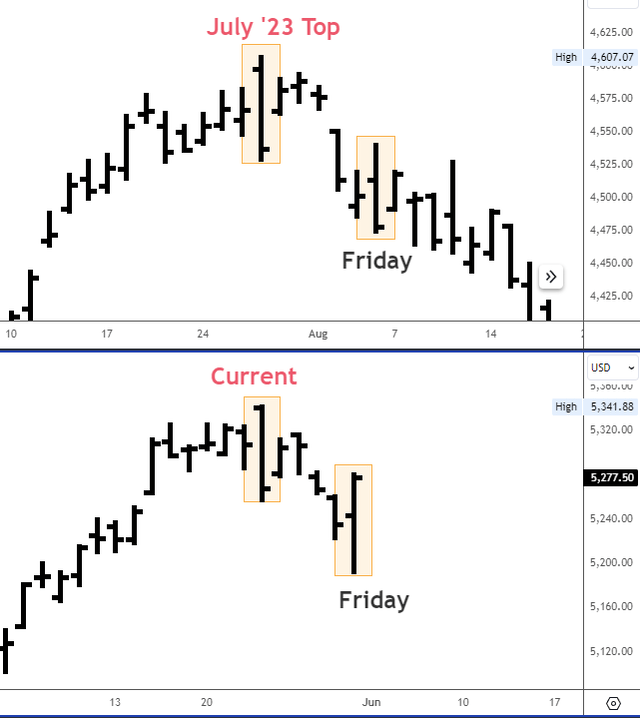
Last week I speculated the correctional aspect of the current decline “suggests there will be a different (bullish) outcome.” This worked out, but again, I did not expect the resolution to play out quite like it did. It now looks like the patterns will continue to diverge.
Friday’s rally peaked at 5280, just shy of potential resistance at the 5282 gap. Gap fill at 5306 and the weekly high at 5316 are the next resistance.
Friday’s 5191 low and the 50dma just below are first support. 5123-5127 is the next level below there, then 5000-5011.
A downside Demark exhaustion signal will be on bar 7 (of 9) on Monday, but Wednesday’s session would need to close below 5235 for it to complete.
Drivers/Events
Weak Treasury auctions and solid consumer confidence data caused a rally in yields early in the week which reversed sharply on Friday after the PCE Index came in at 0.2% versus 0.3% expected. I actually think the moves in yields/bonds have been a lot cleaner and logical than the moves in stocks. The 10-year is likely to drop to around 4.2% in the coming weeks, which would be a tailwind for the S&P500.
Next week’s data revolves around the labour market, with JOLTS Job Openings due for release on Tuesday and NFP on Friday. Given the bullish reaction to weak data in the last Jobs Report, bulls will want to see more evidence of cooling.
Outside the US, the ECB are all set to cut rates next Thursday, and the BoC could also potentially cut on Wednesday. These moves are almost fully priced in, but the market reaction could still be interesting and set a precedent for when the Fed eventually cut.
Probable Moves Next Week(s)
Bigger picture, and ignoring the noise, the view remains the same as previous weeks. A new high above 5341 remains probable and 5400-412 is the likely target.
Predicting the exact path higher is obviously difficult. Some aspects look clearer than others. Friday’s close at the highs of the session suggests there should be further upside in the short-term. Any dip from 5280-82 resistance on Monday/Tuesday likely holds 5257-64 and recovers for 5306-16 and last week’s high.
Beyond that, the issue is how the S&P500 deals with the 5341 all-time high. If the move there is very direct, it is unlikely it will have the energy to make a clean break. In this case, a fake-out to 5350-60 could lead to another sharp reversal below 5300 again. On the other hand, if there is a consolidation or a decent dip below 5341, the break to new highs could be more sustained.
Credit: Source link