
cemagraphics
An eventful week ended in little net movement – the S&P500 (SPY) closed just +28 points higher. However, the combination of a dovish FOMC and softer labor market readings did help drive a strong Thursday and Friday. The lack of a further rally could simply be a case of stopping the clock on the action at Friday’s close. As last weekend’s article concluded, “the bounce can break above 5108 resistance. This likely targets 5168-74 where another leg lower should set up.”
This weekend’s article will look at the next probable swings in what is becoming a complex pattern. It will also look at the bigger picture and what to expect in May. Various techniques will be applied to multiple timeframes in a top-down process which also considers the major market drivers. The aim is to provide an actionable guide with directional bias, important levels, and expectations for future price action.
S&P 500 Monthly
The April bar closed in the lower half of the monthly range at 4953 which gives it a neutral to bearish look. Downside follow through in May is likely, although needs to be taken in context of the overall bullish bias for new highs described in previous articles. In other words, there is no compelling short set-up, but a further drop would set up a buying opportunity.
The similarities in recent months with the monthly pattern created from June-August last year were slightly spoiled by the weaker April close. It may still act as a general guide and suggests May will trade lower (akin to September ’23 bar).
SPX Monthly (Tradingview)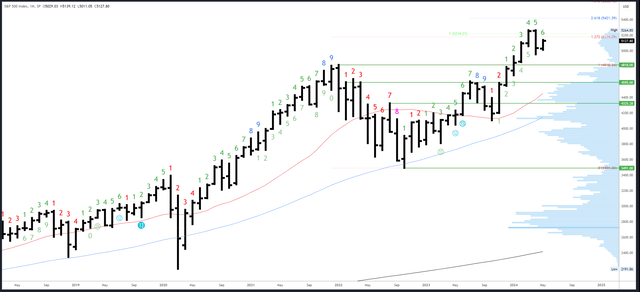
The 5264.85 high is the only resistance.
April’s low of 4953 is minor support. 4853 and 4818 are major levels below there.
April is bar 6 (of a possible 9) in an upside Demark exhaustion count.
S&P 500 Weekly
The 20-week MA held again for the third week. A higher low, higher high and higher close were all formed on the weekly bar, although the action remained inside the large range of the bar formed in the week of 15th April. A close outside this bar’s range, i.e. above 5168, is needed to negate the bearish bias.
The weak low at 4953 continues to be a red flag. I’d much prefer to see a lower low and stronger bottom, but I’m well aware the market does not care about my preferences. The October ’23 bottom came from a similar weak low, and if the bullish signals start to add up, I may have to conceded the bottom is already in.
SPX Weekly (Tradingview)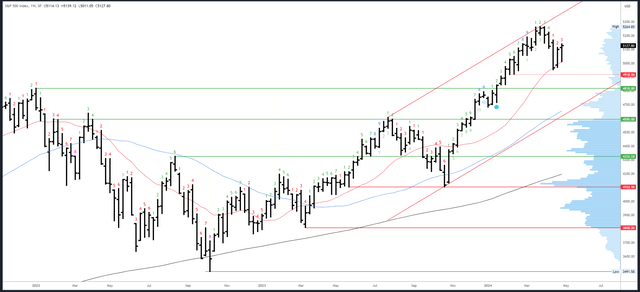
5168 is the next level of resistance, then the 5264 high.
The 20-week MA has held as support. If this breaks, the 4918-20 area is minor support, then 4845 and 4818.
The upside Demark exhaustion signal looks to be having an effect with a similar delay to the July ’23 signal. A new downside count is underway and will be on bar 4 next week.
S&P 500 Daily
Last week’s article noted, “This corrective phase will likely chop back and forth and may need to squeeze out shorts before the next drop.” This process looks to be underway as the 20dma acted as resistance for most of the week but then broke. Thursday and Friday’s sessions were very similar to the Thursday and Friday from the previous week and the rally is now attempting to break the 50dma. Shorts may capitulate if it succeeds.
The volume profile to the right of the chart is starting to develop a bell curve based around the centre of the 4953-5268 range, i.e. 5110ish. Expect volume to taper off at the edges and more volume (and time spent) near the centre.
SPX Daily (Tradingview)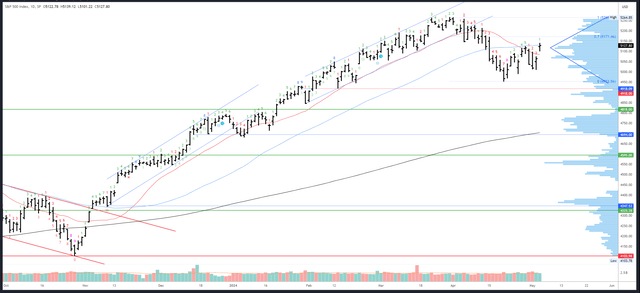
5168-74 is the next resistance, then gap fill at 5199. 5256-64 is obvious resistance at the highs.
Immediate support is at Friday’s low of 5101, then the 20dma around 5085. As mentioned earlier, 4953 is a weak low. Minor support is the futures low of 4924 in confluence with the 4918-20 pivots. The gap at 4845-53 is actually a monthly gap so is relevant for a bounce, but all roads seem to lead to 4818.
The choppy conditions mean no Demark exhaustion signal has progressed. An upside count will be on bar 2 (of 9) on Monday and cannot complete next week.
Drivers/Events
The Fed stayed unconcerned with inflation and relatively dovish. Any sequence of cooler inflation readings or weak employment data could ensure three cuts are still delivered this year starting in September or even July. This is more than the market currently expects as only 28bps of easing was priced in before the FOMC meeting (this has now risen closer to 40bps).
Data next week is very quiet with only Unemployment Claims on Thursday and some bond auctions scheduled. Earnings season is also winding down and it is worth noting Meta (META) is the only of the “Mag 7” to have had a negative reaction to earnings so far. Nvidia (NVDA) will be the last to report on 22nd May.
A quieter calendar could mean this week’s drivers continue to have an effect and the dovish shift in expectations lifts the S&P500 further.
Probable Moves Next Week(s)
The S&P500 is making a choppy, complex correction suited to the mixed drivers. Weaker economic data is being balanced out by higher odds of easing.
Calling each swing in this phase will be a challenge, but the action at the end of this week suggests there are good odds of a move higher next week. This should squeeze out shorts above the 50dma and target the next area of interest at 5168-74 where a reversal could develop. A Friday close above 5168 would suggest the bounce can continue above 5200.
Bigger picture, the April bar and the weak low on the weekly chart suggest further downside at some point in Q2. The 4818 re-test remains a magnet, although I suspect the route there will be erratic and there will be several occasions when it looks like the uptrend has resumed in earnest.
Credit: Source link