

ismagilov
The S&P 500 (SPY) popped higher again this week and finally reached the long-standing target of 5400-412. As made clear in last week’s article, this was a place to re-assess rather than close everything and go short, and thankfully the set-up was clear enough to stay bullish. More on this later.
With inflation slowing and cuts on the way, it looks like the coast is clear for a sustained rally. However, markets don’t need bad news to top and reverse – indeed, they often top on good news when the trend is exhausted. As Tom Demark explains,
Figuratively speaking, markets top not because of smart sellers, but because the last buyer has bought.
Two higher timeframe exhaustion signals will be active in the next few weeks and the S&P500 may finally be lining up for a major reversal. This week’s article will outline how to spot one.
S&P 500 Monthly
The June bar is trading in blue sky with only minor Fibonacci expansions and measured moves in the area. The next major level comes from the 1.618* expansion of the 2021-2022 bear market and is way up at 5638. I don’t know if it will be reached on this phase of the rally, but this is probably the ultimate goal at some stage.
SPX Monthly (TradingView)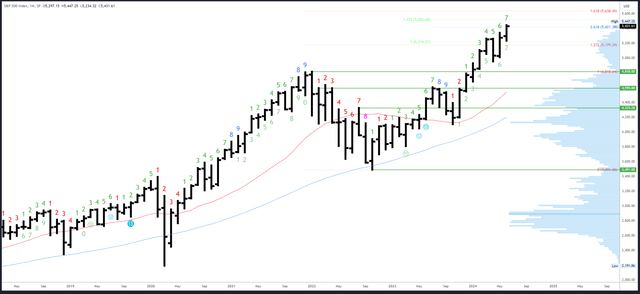
The Fibonacci extension at 5421 was a minor extension from the July-October ’23 pullback and was easily exceeded. 5522 is a minor measured move.
May’s high of 5341 is now important as the S&P500 has traded over 100 points above it. Should prices drop back inside May’s range, the bias would shift neutral, potentially bearish if the June bar closes near its open of 5297.
June is bar 7 (of a possible 9) in an upside Demark exhaustion count. These counts can have an effect from bar 8 onwards so a reaction could be seen in July.
S&P 500 Weekly
The previous week’s bullish bias followed through with a clean move higher. This chart is about as bullish as it gets, but it can all change very quickly.
A close below 5265 at this stage would be a clear red flag, but is too distant to be useful. The previous week’s high of 5375 provides a tighter set-up and the daily chart reveals it could be key to short-term direction.
SPX Weekly (TradingView)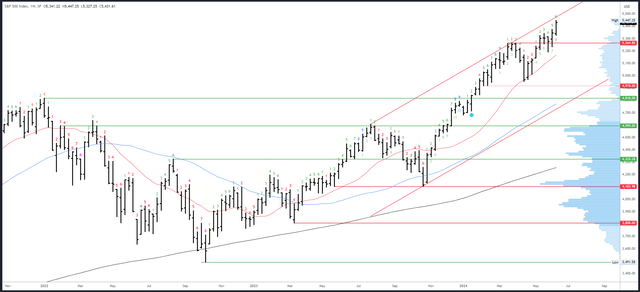
The weekly channel high is potential resistance and will be around 5490 next week.
5375 and 5265 are key supports.
Next week will be bar 7 (of 9) of an upside Demark exhaustion count. As noted earlier, these counts can have an effect from bar 8 onwards so a possible reaction is getting closer and the monthly/weekly counts will be in sync from the first week in July.
S&P 500 Daily
While Wednesday’s large rally made the headlines, there wasn’t much trading to be done after CPI was released. Tuesday’s session provided the trading opportunity as the dip to support at 5327 led to a strong reversal and a close right at the highs of the session which was also a new all-time high of 5375.95. Did Tuesday’s buyers know CPI would be positive? Who knows, but we can at least try to follow their actions. As I said last week,
Friday’s low of 5331 and the pre-market low of 5319 are important for short-term direction. A break of this area would target 5265-81. A hold targets 5400-412.
Finding good inflection points is key, and the market created another one on Wednesday as the gap up must now hold to maintain the near-term bullish bias. The lows of Wednesday and Thursday should therefore really act as support and a gap below 5402 could be bearish; if it holds below that level, it would create an “island top” and trap all the buyers above.
SPX Daily (TradingView)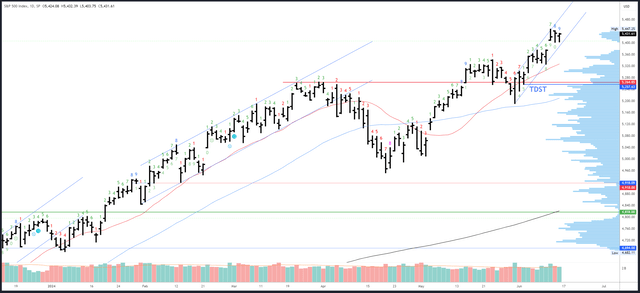
Wednesday’s 5447 high is the only real resistance.
On the downside, 5402 is the level to watch early in the week. A drop below would be a warning the gap will close back to 5375 and the rest of the week would likely be choppy and drop into the 5360s, even 5350s The 20dma will at 5334 on Monday and rising about 6 points a session so perhaps this will meet the dip later in the week. 5257-64 is the next major support.
An upside Demark exhaustion signal completed on Friday. This does heighten the odds that Wednesday’s gap was an exhaustion gap and will drop back again.
Drivers/Events
The big catalyst this week was obviously the CPI report. With a 0% m/m headline figure and 0.16% core reading, this was the best inflation news in a long time. It was balanced to a degree by the FOMC meeting which was relatively hawkish, with only one cut projected this year, higher inflation projections and a higher estimated neutral rate. I’d guess this could all change on a dime, though, and the hawkish aspects may have been an attempt to keep a lid on the rally. Unemployment claims edged higher again to +242K and if this gets any higher, the Fed could end up making three cuts after all.
Next week’s data might not make too many headlines, but it will provide an interesting check on the US economy and whether the cooling jobs market is a symptom of real weakness. The Empire State Manufacturing Index is due out on Tuesday, Retail Sales on Wednesday, Unemployment Claims on Thursday and Flash PMIs on Friday. I suspect some of the data could come in soft as bonds have broken out and have room to run to the upside.
Note: markets will be closed on Wednesday for the Juneteenth National Independence Day.
Probable Moves Next Week(s)
The higher timeframes have a bullish bias while above the May high of 5341 and this month likely closes strong to complete a bullish Q2 bar. Q3 could bring change, however, as exhaustion signals on the monthly and weekly charts are lining up.
Short-term direction hinges on 5402. Wednesday’s CPI inspired gap can be classed as a bullish continuation gap as long as the gap holds above 5375 (and as an early warning 5402 should really hold). If the gap fills, and I suspect it will, it can be classed as an exhaustion gap and the path is likely lower-to sideways for the rest of the week to meet the 20dma in the 5350s. From that point, there should be another chance to try longs for a leg higher into Q3.
Closing below 5341 would be a warning the top could be in already.
Credit: Source link