

cemagraphics
The S&P500 (SPY) ended Q1 and the month of March at 5254. It has gained 28% in less than six months and now has a PE ratio of 24.6. How can anyone buy this high?!
Actually, it’s not that difficult; the key is to blank out how overvalued you think it may be, or how far it could fall, and defining (minimizing) your risk against a point where you know your trade idea is wrong. In each article I provide guidance to where the trend will shift from bullish to bearish and this is an optimal entry point. If you are wrong, you won’t be wrong for long and shouldn’t lose much money.
For example, last weekend’s article concluded, “a small dip should hold 5179-89 in the first half of the week and lead to new highs.” Tuesday’s dip to 5203 was therefore an opportunity to buy against the highlighted level. Granted, the gains may be limited, but there was about 30 points risk for a potential 60, 90, (who knows how much in this crazy trend), reward.
This weekend’s update will look at expectations for Q2 and again highlight important levels for the trend to hold. Various techniques will be applied to multiple timeframes in a top-down process which also considers the major market drivers. The aim is to provide an actionable guide with directional bias, important levels, and expectations for future price action.
S&P 500 Monthly
March and Q1 closed at 5254, just 10 points off an all-time high. The odds are therefore heavily in favour of continuation in April and Q2. Furthermore, seasonality is quite strong and there is no real resistance.
Looking further out, when January, February and March all close higher like they have this year, the rest of the year has closed higher 19 out of 20 times.
While this is an interesting stat, there will still be dips along the way. Once new highs are made, a higher timeframe reversal can develop with a drop back into the March / Q1 range. We would need to see how April closes before deducing anything, but it is something to keep in mind.
SPX Monthly (Tradingview)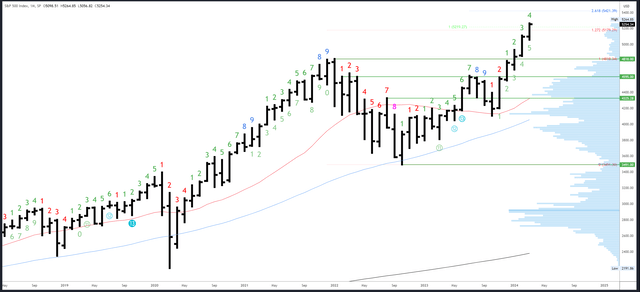
So far, there has been very little reaction at any of the previous Fib targets. There is a measured move at 5371 where the rally starting at the January low is equal to the October-December ’23 rally.
The March high of 5264 and the February high of 5111 are potentially important levels to the downside.
April will be bar 5 (of a possible 9) in an upside Demark exhaustion count.
S&P 500 Weekly
The weekly chart is back to the usual pattern of 2024 with a higher high, higher low and higher close. This is consolidating the previous break above 5189 and projects continuation next week.
SPX Weekly (Tradingview)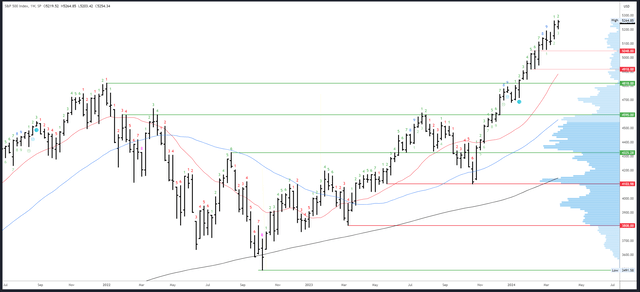
The 5179-5189 breakout level is key. Should this break, the gap at 5117-5131 is an area for a bounce, but 5048-5056 is the likely destination.
An upside Demark exhaustion signal is active, but perhaps the two week pause in the first half of March is the only reaction it will get. A new signal is at least 7 weeks away.
S&P 500 Daily
The daily chart continues to hold the trend channel and 20dma. It also continues to follow the repeating pattern from February I first highlighted two weeks ago. This now suggests the move to new highs will unwind back to 5203 with a sharp drop similar to March 5th. Obviously, neither the repetition or the trend channel can continue indefinitely, but a sharp dip back to 5203, maybe the 5190s could be a low risk opportunity to trade against a breakdown.
SPX Daily (Tradingview)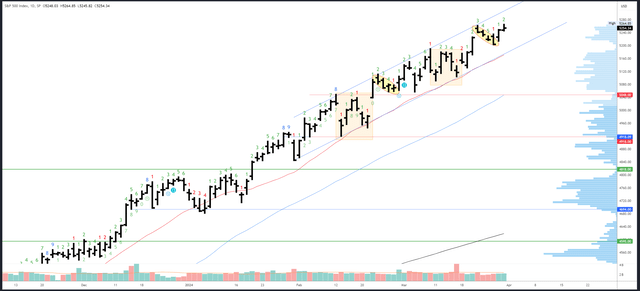
The top of the channel will be at 5310 and rising around 10 points a day.
5203 is a weak low / close and likely re-visited and undercut. 5179-89 is more important and could line up with channel support and the 20dma.
Last week’s Demark exhaustion signal did not complete due to the choppy conditions. A new count will be on bar 3 on Monday and cannot complete next week.
Drivers/Events
Friday’s release of the Core PCE Price Index showed a reading of 0.3% and last month’s figures was revised higher to 0.5%. There has been a clear tick higher in recent months and the 3-month annualized figure has increased from below 2% to 3.5%. Given the Fed’s recent dovish communication, I suspect they will stay quiet and hope this problem goes away. That said, Powell is due to speak on Wednesday so pay close attention.
Earnings season is already underway but only really gets interesting in mid April when the big banks report. With the economy hotting up in Q1, the numbers should be solid enough, but have a lot to live up to – according to the S&P, earnings are expected to grow 30.6% by the end of 2025.
With so much growth expected and priced in, strong data is a must and this week’s Final GDP of 3.4% (est. 3.2%) is the kind of thing bulls will want to see, especially since the Fed suggested there is no reading too hot or too high for them to reconsider cuts. Next week’s Jobs Report should produce a bullish reaction as long as it is strong or in line with expectations. A big miss would be something different and perhaps an interesting tell – will the market worry about the economy or rejoice as cuts are more assured? It may well be the latter initially, but the recent rally does suggest the market cares more about the economy/earnings than it does about cuts so I’m working on the assumption that weak data will equal a weak market.
Probable Moves Next Week(s)
The strong close to March and Q1 projects continuation to new highs in April and Q2. 5300 and 5371 are the next upside targets.
Be careful of a failed new high that quickly reverses as it would suggest the repeating pattern on the daily chart can continue with a sharp drop back to undercut the weak low of 5203. This would test the channel and the 20dma which is key for next week and indeed the rest of April.
As there are many eyes on the now obvious channel, spikes and “messy” action could unfold. 5179 is a more defined inflection point – a break of this level would confirm the near-term trend is compromised and weekly supports of 5117-5131 and 5048-5056 should then be in play.
Credit: Source link