
• bitcoinBitcoin(BTC)$81,270.000.00%
  • ethereumEthereum(ETH)$2,627.400.31%
  • tetherTether(USDT)$1.00-0.01%
  • binancecoinBNB(BNB)$762.55-0.11%
  • rippleXRP(XRP)$1.41-0.07%
  • usd-coinUSDC(USDC)$1.00-0.01%
  • solanaSolana(SOL)$110.96-1.99%
  • tronTRON(TRX)$0.3398780.46%
  • zcashZcash(ZEC)$1,473.81-6.39%
  • Figure HelocFigure Heloc(FIGR_HELOC)$1.02-1.49%
  • HyperliquidHyperliquid(HYPE)$92.09-1.02%
  • dogecoinDogecoin(DOGE)$0.087631-0.29%
  • moneroMonero(XMR)$541.82-5.84%
  • whitebitWhiteBIT Coin(WBT)$82.88-0.53%
  • RainRain(RAIN)$0.0137362.56%
  • USDSUSDS(USDS)$1.00-0.02%
  • chainlinkChainlink(LINK)$12.400.38%
  • cardanoCardano(ADA)$0.2288790.46%
  • leo-tokenLEO Token(LEO)$8.91-0.06%
  • stellarStellar(XLM)$0.1958820.62%
  • uniswapUniswap(UNI)$8.63-3.18%
  • bitcoin-cashBitcoin Cash(BCH)$254.40-0.95%
  • Ethena USDeEthena USDe(USDE)$1.00-0.01%
  • avalanche-2Avalanche(AVAX)$10.6427.80%
  • nearNEAR Protocol(NEAR)$3.55-4.56%
  • daiDai(DAI)$1.00-0.01%
  • litecoinLitecoin(LTC)$58.12-1.37%
  • USD1USD1(USD1)$1.00-0.01%
  • CantonCanton(CC)$0.108156-3.27%
  • the-open-networkGram (prev. Toncoin)(GRAM)$1.391.11%
  • hedera-hashgraphHedera(HBAR)$0.0822033.65%
  • suiSui(SUI)$0.875.22%
  • MemeCoreMemeCore(M)$1.5316.86%
  • shiba-inuShiba Inu(SHIB)$0.0000061.26%
  • Global DollarGlobal Dollar(USDG)$1.00-0.01%
  • BittensorBittensor(TAO)$267.525.86%
  • crypto-com-chainCronos(CRO)$0.059665-0.62%
  • paypal-usdPayPal USD(PYUSD)$1.00-0.03%
  • tether-goldTether Gold(XAUT)$4,373.74-0.03%
  • Circle USYCCircle USYC(USYC)$1.140.00%
  • okbOKB(OKB)$117.490.60%
  • Ripple USDRipple USD(RLUSD)$1.000.01%
  • BlackRock USD Institutional Digital Liquidity FundBlackRock USD Institutional Digital Liquidity Fund(BUIDL)$1.000.00%
  • Ondo US Dollar YieldOndo US Dollar Yield(USDY)$1.150.27%
  • aaveAave(AAVE)$140.72-1.71%
  • EthenaEthena(ENA)$0.20745721.75%
  • mantleMantle(MNT)$0.62-0.90%
  • AsterAster(ASTER)$0.76-2.22%
  • OndoOndo(ONDO)$0.4216504.86%
  • Pump.funPump.fun(PUMP)$0.004214-0.10%
TradePoint.io
  • Main
  • AI & Technology
  • Stock Charts
  • Market & News
  • Business
  • Finance Tips
  • Trade Tube
  • Blog
  • Shop
No Result
View All Result
TradePoint.io
No Result
View All Result

S&P 500: Hold Your Nose And Buy, Week Starting June 24th (Technical Analysis) (SP500)

June 23, 2024
in Market & News
Reading Time: 5 mins read
A A
S&P 500: Hold Your Nose And Buy, Week Starting June 24th (Technical Analysis) (SP500)
ShareShareShareShareShare

ismagilov

YOU MAY ALSO LIKE

House GOP conference chair acknowledges ‘gas prices are not where we want them to be’

Steve Kornacki previews generational change fights in Massachusetts primary

The S&P 500 (SPY) briefly exceeded 5500 this week and the 5400 inflection point pointed out in last weekend’s article was never in danger of breaking. In theory, it should be quite simple to buy against these levels – the risk is defined (and low), plus the trend is clearly higher so odds are in your favor. In practice, it is, for one reason or another, very difficult; there are always things to worry about.

One of these days, buying against an inflection point will not work. We can then take a small loss and re-assess. Until that day, it is the one of the best approaches to joining the trend, even when we think it might be in the final stages. No-one really knows where it could end up.

This week’s article will update inflection points and outline expectations for the last week of Q2. Various techniques will be applied to multiple timeframes in a top-down process which also considers the major market drivers. The aim is to provide an actionable guide with directional bias, important levels, and expectations for future price action.

S&P 500 Monthly

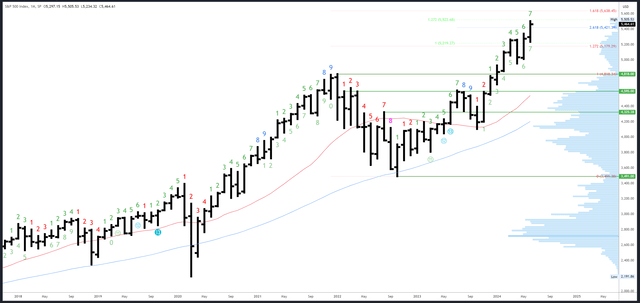
The June bar and the Q2 bar will close this Friday. This has been the third very strong quarter in a row, and as the last two closed near the highs, it likely does the same. As an aside, all three quarterly bars will have closed on a Friday, which must be fairly unusual and may have aided the strong closes. The Q3 bar will close on a Monday.

A strong close near 5500 would project continuation higher early in July.

With only 5 days left in June, the bar is set high for a bearish bar to form with a close back inside May’s range below 5341.

SPX Monthly

SPX Monthly (Tradingview)

With the S&P500 trading into new all-time highs, Fibonacci extensions and measured moves provide targets. 5522 is the next minor measured move (it is where the rally from the Oct ’23 low = 1.272% of the Oct ’22 – July ’23 rally). The next major level comes from the 1.618* expansion of the 2021-2022 bear market and is way up at 5638.

May’s high of 5341 is now important as the S&P500 has exceeded it significantly. Should prices drop back inside May’s range, the bias would shift bearish, especially if the June bar closes near its open of 5297.

June is bar 7 (of a possible 9) in an upside Demark exhaustion count. These counts can have an effect from bar 8 onwards so a reaction could be seen in July.

S&P 500 Weekly

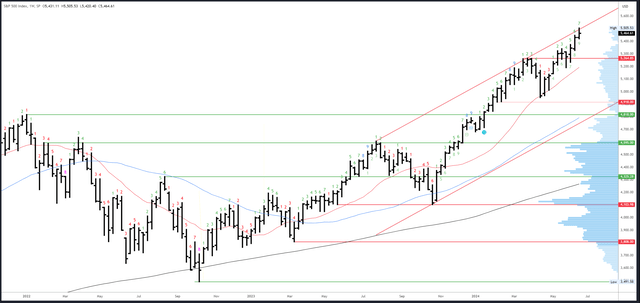
The rally has reached and reacted from the top of a potential channel which may limit progress. This doesn’t necessarily mean the rally will reverse, though, and it could simply hug the channel as it moves higher.

This week’s bar made a higher low, higher low and higher close which is obviously bullish, but the close was off the highs and this shifts the bias more neutral for next week.

SPX Weekly

SPX Weekly (Tradingview)

The weekly channel high will be around 5510 next week.

This week’s low of 5420 is initial support. 5265 is a major level, but should not be tested if this rally is to stay strong.

Next week will be bar 8 (of 9) of an upside Demark exhaustion count. As noted earlier, these counts can have an effect from bar 8 onwards so a reaction is possible in the coming weeks. The monthly/weekly counts will be in sync from the first week in July.

S&P 500 Daily

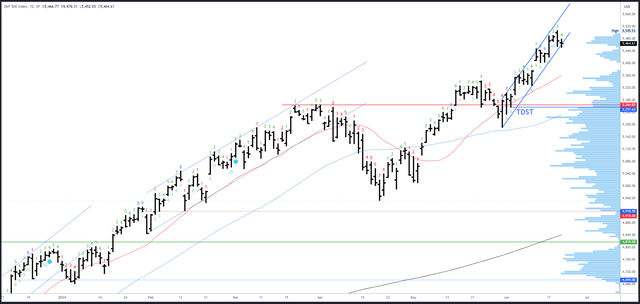
Thursday’s higher open and fade formed a classic exhaustion gap and was accompanied by a big reversal on Nvidia (NVDA). This looks very similar to the pattern formed on 8th March which marked an intermediate top in NVDA, but not for the S&P500 which consolidated and then made new highs several weeks later. Perhaps a similar scenario unfolds again.

This week’s reversal pattern likely leads to a break in the daily trend channel and some mild weakness at the start of next week. We can assume this is just an ordinary bullish consolidation / dip as long as 5400 holds, and this remains the major inflection.

SPX Daily

SPX Daily (Tradingview)

Thursday’s 5505 high is the only real resistance.

On the downside, 5440 is initial support, but the big level is 5400.

An upside Demark will be on bar 5 on Monday. A reaction could be seen on Thursday or Friday (bars 8 or 9) but this relies on the count continuing. Monday has to close above 5473 for this to happen.

Drivers/Events

This week’s data was cool but mostly better than expected and not at all indicative of an economy in imminent danger. With the odds of cuts in September now around 65%, data like this is ideal for the S&P500 – not too hot to delay cuts and not too weak to fret over the economy.

Next week’s scheduled events are on the quiet side until Thursday when GDP, Unemployment Claims and Pending Home Sales are due for release. It is doubtful if these will move markets much, especially ahead of the highlight of the week, Friday’s PCE Index. This is the Fed’s preferred inflation gauge and a soft reading would likely boost the odds of a September cut.

Probable Moves Next Week(s)

In the short-term, Thursday’s reversal could lead to further downside to 5440, perhaps 5400, which remains a key inflection for this stage of the rally. A dip near these levels could be a place to “hold your nose and buy.” You might not like it, it might not work, but it is the right approach as Q2 likely closes strong and the higher timeframes continue to have a bullish bias.

Credit: Source link

ShareTweetSendSharePin

Related Posts

House GOP conference chair acknowledges ‘gas prices are not where we want them to be’
Market & News

House GOP conference chair acknowledges ‘gas prices are not where we want them to be’

September 20, 2026
Steve Kornacki previews generational change fights in Massachusetts primary
Market & News

Steve Kornacki previews generational change fights in Massachusetts primary

September 20, 2026
Motorcyclist in Colombia crashes into bus at full speed
Market & News

Motorcyclist in Colombia crashes into bus at full speed

September 19, 2026
Vanderbilt wins in stunning fashion after NC State QB CJ Bailey fumbles in end zone with 1 second left – Yahoo Sports
Market & News

Vanderbilt wins in stunning fashion after NC State QB CJ Bailey fumbles in end zone with 1 second left – Yahoo Sports

September 19, 2026
Next Post
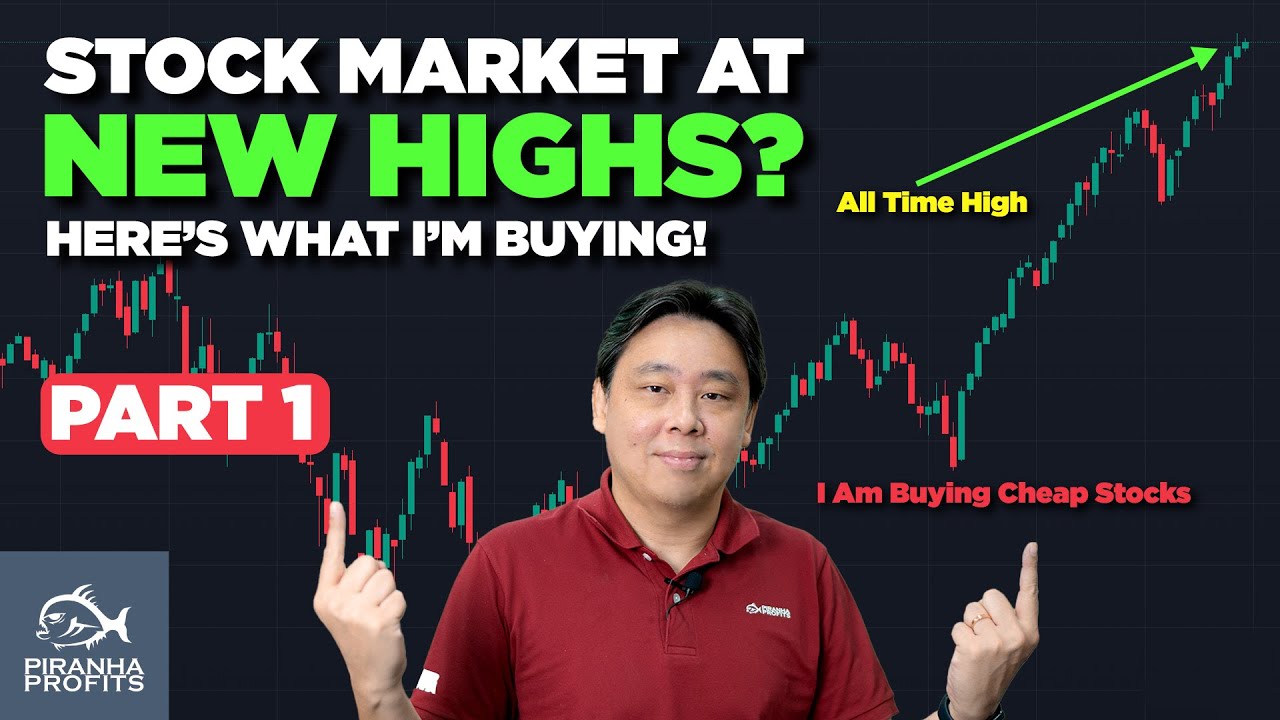
Stock Market at New Highs? Here’s What I’m Buying Part 1 of 2

Stock Market at New Highs? Here's What I'm Buying Part 1 of 2

Leave a Reply Cancel reply

Your email address will not be published. Required fields are marked *

Search

No Result
View All Result
New study shows promising results for drug in treating lung cancer

New study shows promising results for drug in treating lung cancer

September 19, 2026
Is Trump’s k ‘dividend’ plan possible?

Is Trump’s $5k ‘dividend’ plan possible?

September 14, 2026
Lutnick says promised ,000 checks for Americans won’t come from taxpayer dollars

Lutnick says promised $5,000 checks for Americans won’t come from taxpayer dollars

September 13, 2026

About

Learn more

Our Services

Legal

Privacy Policy

Terms of Use

Bloggers

Learn more

Article Links

Contact

Advertise

Ask us anything

©2020- TradePoint.io - All rights reserved!

Tradepoint.io, being just a publishing and technology platform, is not a registered broker-dealer or investment adviser. So we do not provide investment advice. Rather, brokerage services are provided to clients of Tradepoint.io by independent SEC-registered broker-dealers and members of FINRA/SIPC. Every form of investing carries some risk and past performance is not a guarantee of future results. “Tradepoint.io“, “Instant Investing” and “My Trading Tools” are registered trademarks of Apperbuild, LLC.

This website is operated by Apperbuild, LLC. We have no link to any brokerage firm and we do not provide investment advice. Every information and resource we provide is solely for the education of our readers. © 2020 Apperbuild, LLC. All rights reserved.

No Result
View All Result
  • Main
  • AI & Technology
  • Stock Charts
  • Market & News
  • Business
  • Finance Tips
  • Trade Tube
  • Blog
  • Shop

© 2023 - TradePoint.io - All Rights Reserved!