
cemagraphics
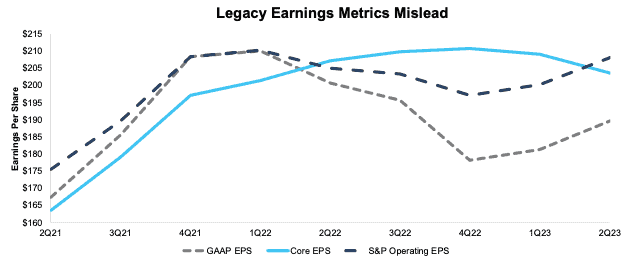
Investors should expect more negative earnings surprises in 2H23 than usual. The numerous earnings beats in 1H23 were artificially set up when companies “kitchen-sinked” 2022. By “kitchen-sinked”, we mean S&P Global’s Operating Earnings and GAAP Earnings steadily declined while Core Earnings[1] rose throughout that year.
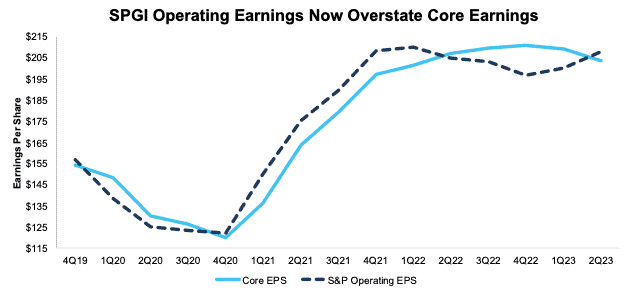
In the first half of 2023, we see the opposite trend. Operating Earnings and GAAP Earnings are rising, while Core Earnings are declining and showing signs of further weakness. In fact, TTM Operating Earnings for the S&P 500 in 2Q23 are now higher than Core Earnings for the first time since 1Q22. See Figure 2 for details.
Core Earnings Tell A Different Story than Legacy Metrics
In the trailing-twelve-months (TTM) ended 2Q23, legacy earnings measures differ widely from Core Earnings. See Figure 1. For example, TTM GAAP and S&P Operating Earnings rose 4% while Core Earnings fell 3% in 2Q23.
Figure 1: Comparing Other Earnings Measures to Core Earnings

New Constructs, LLC
Sources: New Constructs, LLC, company filings, and S&P Global (SPGI). Note: the most recent period’s data for SPGI’s Operating Earnings is based on consensus estimates for companies with a non-standard fiscal year.
The abrupt rise in Operating and GAAP Earnings beats in the first half of 2023 is likely the result of 2022’s kitchen-sinked results, as corporate managers threw in all the expenses they could to tank earnings and set themselves up for easier beats in 2023. We witnessed the same kitchen-sink effect in 2020, when companies used COVID-19 as a justification to record more write-downs than in any year since 2008.
Figure 2: Operating vs. GAAP vs. Core Earnings: S&P 500 Since 2Q21
New Constructs, LLC
Sources: New Constructs, LLC, company filings, and S&P Global. Note: the most recent period’s data for SPGI’s Operating Earnings is based on consensus estimates for companies with a non-standard fiscal year.
What to expect?
The problem, now, however, is that managers have little flexibility to further juice earnings, as inflation and interest rates remain high while future growth is less certain.
With Core Earnings already trending lower, we don’t think companies can achieve the same level of beats in 2H23 as we saw in 1H23. In other words, 3Q23 and 4Q23 earnings seasons could be disappointing and pressure equity markets lower.
Below we highlight the disconnect between traditional earnings measures and our Core Earnings and examine the changes in each metric in recent periods. Well-known flaws in legacy datasets drive the difference between the measures. Core Earnings do a better job of capturing the underlying economic performance of businesses by removing the unusual gains/losses buried in footnotes that legacy datasets miss.
S&P Global’s Operating Earnings Rise Is Not Reflected in Core Earnings
After a steep increase in 1H23, Operating Earnings for the S&P 500 are now higher than Core Earnings for the first time since 1Q22.
In 2Q23, Operating Earnings rose 4% QoQ while Core Earnings fell 3% QoQ in 2Q23. Operating Earnings are 2% higher than Core Earnings in 2Q23. In 1Q23, Operating Earnings were 4% lower than Core Earnings.
Year-over-year (YoY), 2Q23 Core Earnings fell 2% while Operating Earnings, rose 2%.
Figure 3: Trailing Twelve Month Earnings: Core Earnings vs. SPGI Operating Earnings: 4Q19 –2Q23
New Constructs, LLC
Sources: New Constructs, LLC, company filings, and S&P Global. Note: the most recent period’s data for SPGI’s Operating Earnings is based on consensus estimates for companies with a non-standard fiscal year.
Core Earnings Are More Reliable than GAAP Earnings
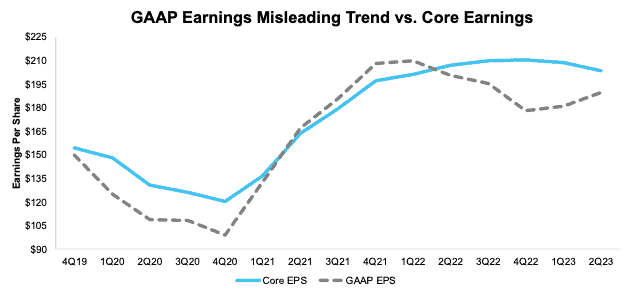
In 2Q23, GAAP Earnings for the S&P 500 not only understate Core Earnings, but are also moving in the opposite direction. Seeing GAAP earnings rise while Core Earnings decline raises red flags about the quality of reported earnings while also raising the risk of earnings misses in subsequent quarters.
In 2Q23, GAAP Earnings rose 4% QoQ while Core Earnings fell 3%. Over a longer time frame, since 2020, Core Earnings have fluctuated less than indicated by GAAP earnings. For instance:
- 1Q21, GAAP earnings: +33% QoQ versus +13% for Core Earnings.
- 2Q22, GAAP earnings: -5% QoQ versus +2% for Core Earnings.
- 3Q22, GAAP earnings: -3% QoQ versus +1% for Core Earnings.
- 4Q22, GAAP earnings: -8% QoQ versus <-1% for Core Earnings.
- 1Q23, GAAP earnings: +1% QoQ versus -1% for Core Earnings.
- 2Q23, GAAP earnings: +4% QoQ versus -3% for Core Earnings.
Figure 4: Trailing Twelve Month Earnings: Core Earnings vs. GAAP Earnings: 4Q19 –2Q23
New Constructs, LLC
Sources: New Constructs, LLC and company filings
Diligence Matters – Superior Fundamental Analysis Provides Insights
As traditional earnings measures both over and understate the S&P 500’s Core Earnings, the index requires more earnings growth than analysts expect to justify its current valuation. Based on macro-economic factors, such as inflation, high rates, the uncertain impact of student loan payments resuming, and more, investors can expect more companies warning about slowing earnings growth or even outright decline in coming quarters. While the kitchen sink is easy to spot, as we did in 1H22, the subsequent rise in GAAP earnings could be short-lived.
This article originally published on September 19, 2023.
Disclosure: David Trainer, Kyle Guske II, Italo Mendonça, and Hakan Salt receive no compensation to write about any specific stock, style, or theme.
Appendix I: Core Earnings Methodology
In the Figures above, we use the following to calculate Core Earnings:
- aggregated quarterly data for constituents in the S&P 500 for each measurement period post 6/30/13 to the present
[1] Our Core Earnings research is based on the latest audited financial data, which is the calendar 2Q23 10-Q in most cases.
Credit: Source link