
cemagraphics
The S&P 500 (SPY) made another decisive break higher this week. This follows several weeks of stalling and a shift in market behaviour (lower weekly closes, weaker action on Fridays) which failed to deliver a decisive breakdown. As last weekend’s article concluded, “The charts show indecision rather than a strong signal either way…the odds still slightly favour the bulls.” As we will see later in this article, the rally continues to hold the trend channel.
This weekend’s update will look at the higher timeframe view, new upside targets and moves the bearish inflation points further up. Various techniques will be applied to multiple timeframes in a top-down process which also considers the major market drivers. The aim is to provide an actionable guide with directional bias, important levels, and expectations for future price action.
S&P 500 Monthly / Quarterly
Next week will be the last week of Q1 and it is important to always keep the higher timeframes in mind (I also monitor the yearly bars which happened to complete an exhaustion signal in 2020). On March 3rd I commented on how bullish the quarterly bar was shaping up and speculated it “likely closes strong (which obviously would mean March also closes strong).” This looks to be playing out and end of quarter window dressing will help the bullish view.
The Q2 bar likely continues higher in early April, and while I still think we could see a correction, I will leave any speculation out of my analysis. The first step to a reversal will be to trade back into the range of Q1.
SPX Quarterly (Tradingview)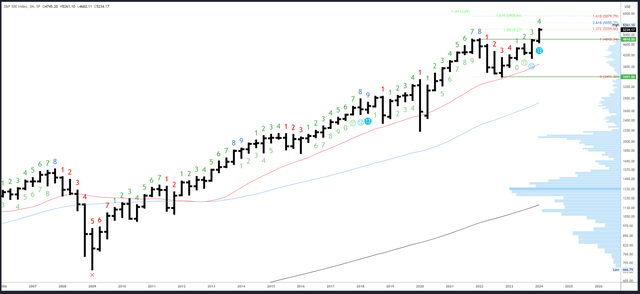
On the monthly chart, the March bar will likely form a continuation bar for follow through in April. The rally has now flown past the 5219 level of the measured move where the current rally from the October ’23 low was equal in size to the October ’22 – July ’23 rally. The next Fib extension of any significance is way up at 5421, but there may still be a reaction from the measured move which is more important.
SPX Monthly (Tradingview)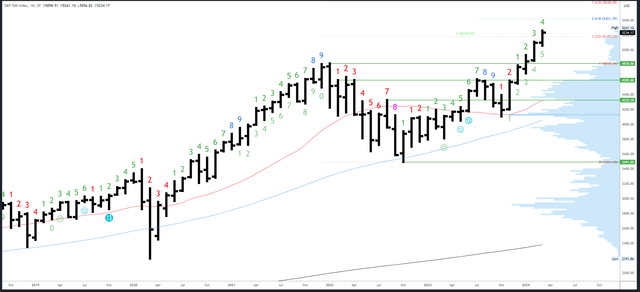
So far, there has been very little reaction at any of the previous Fib targets which speaks of the strength of the trend. 5421 is the 261% extension of the July-October ’23 pullback, but is not a key measurement and is not in confluence with anything else. Other major targets are way higher which makes me think we could still see a reaction in the 5200-300 area from the major measured move mentioned earlier.
The March range will be important once set at next week’s close. The February high of 5111 is also potentially significant.
There will be a long wait for the next monthly Demark signal. March is bar 4 (of a possible 9) in a new upside exhaustion count.
S&P 500 Weekly
After two weekly “doji” bars, the rally sprang back to life. As highlighted last week, a “doji” simply signals indecision – it can lead to a reversal but is certainly not bearish on its own.
A continuation bar formed this week which suggests the S&P500 can make further highs above 5261 next week.
SPX Weekly (Tradingview)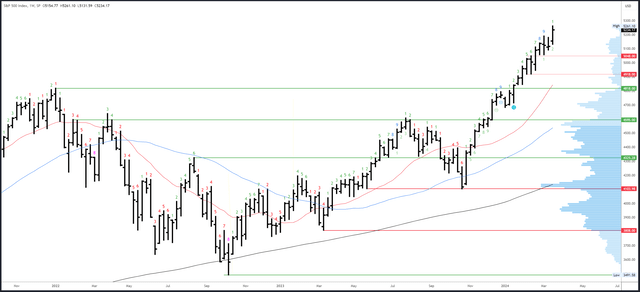
The 5261 high is the only real resistance.
The gap at 5117-5131 is the first support area, while 5048-5056 is a key inflection zone.
An upside Demark exhaustion signal is active. This caused a stall in recent weeks, and may still cause a reversal, but time is running out.
S&P 500 Daily
Last week’s article highlighted a repeating pattern which projected a strong move to new highs. This played out and looks to be continuing with Thursday and Friday’s small daily bars (similar to 23rd and 26th February – see chart below). It suggests a slow consolidation will form in the first half of next week and lead to a further high followed by a reversal back again.
The daily channel is now well formed and will be closely watched which may lead to some erratic action on the next test of support.
SPX Daily (Tradingview)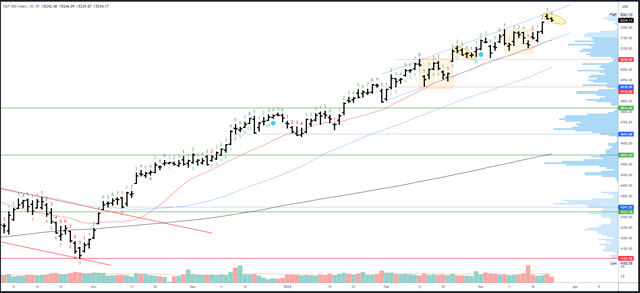
Thursday’s action was mildly bearish and 5261 is resistance. The channel is rising around 10 points each session and could also act as resistance. A measured move comes in at 5371 where the rally starting at the January low is equal to the October-December ’23 rally.
Gap fill at 5226 is initial support. The breakout area of 5179-89 is more important and could line up with channel support and the 20dma which will be at 5151 on Monday and rising around 10 points a day.
A daily Demark exhaustion signal will be on bar 5 (of 9) on Monday. A reaction is usually seen on bars 8 or 9 so Thursday / Friday may see a pause. Since this signal will have to compete with the end of quarter window dressing, I’d pencil a larger reaction in for the first week of April.
Drivers/Events
The FOMC meeting was perceived as dovish even though the 2025 dot plots projected only three cuts instead of four. Markets are more concerned about the here and now and Powell was asked if labor market strength could get the Fed to hold off on cuts. He answered “not necessarily,” which was a relief for the doves and a green light for the rally.
Next week’s calendar is much quieter. Thursday will bring GDP data and Unemployment Claims, Pending Home Sales and Consumer Sentiment. The stronger the better for stocks. Friday’s main event is the release of the Core PCE Price Index which seems irrelevant in light of Fed comments and the market reaction to CPI/PPI. That said, reactions depend on sentiment and positioning so it depends where the S&P500 is trading on Friday at the time of the release, e.g. if it is at the lows of the week and a hot reading comes out, it could lead to a big move down.
Probable Moves Next Week(s)
End of month/quarter window dressing and last week’s break-out suggest the rally should continue to new highs above 5261 with the daily channel likely to act as rising resistance on the way to 5300. Q1 and the month of March likely end near the highs which would project follow through in Q2.
Initial support is at 5226 but 5179-89 is more important. This marks the break-out area and a drop below could lead to a period of weakness with a break of the daily channel / 20dma quite likely on what would be the fifth test. Bulls can bet against this happening next week, and if the comparison highlighted on the daily chart plays out, a small dip should hold 5179-89 in the first half of the week and lead to new highs.
The daily channel will break down eventually, and since it is getting a bit obvious, I’d speculate it breaks in early April. Should this happen, 5048-5056 will be key and an inflection for 4818.
Credit: Source link