

syahrir maulana
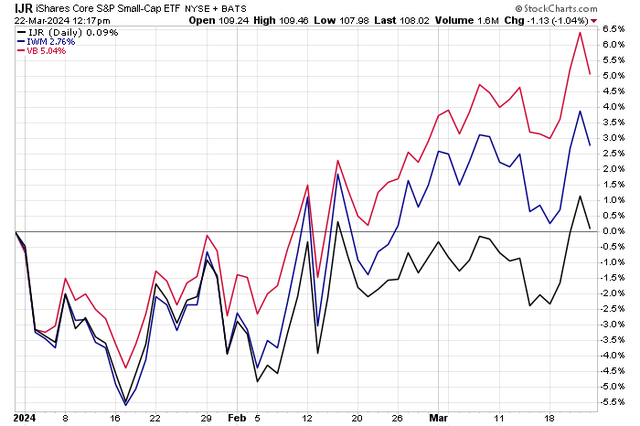
2024 has been a year of return dispersion among various US small-cap ETFs. The Vanguard Small-Cap Index ETF (VB) has performed the best, up 5% in YTD total return through intraday price action on Friday, March 22. The Russell 2000 Small-Cap ETF (IWM) is higher by nearly 3%. Flat on the year, however, is the iShares Core S&P Small-Cap ETF (NYSEARCA:IJR).
Why are the performances so different? AI of course. The largest holdings in VB and IWM have been names like Super Micro Computer (SMCI). VB tracks the performance of the CRSP Small-Cap Index while the Russell 2000 has benefitted from holding some non-profitable, high-growth company shares. Will that keep up though? Better yet, will it really matter? I assert that long-term investors can stick with the S&P SmallCap 600 Index as it has a profitability screen and is larger in average market cap compared with many other small-cap funds.
I have a buy rating on IJR. I see its valuation as attractive today, despite a strong rally off lows notched last October, while IJR’s low cost and diversified nature offer investors significant upside potential today.
IJR Underperforming Its Small-Cap ETF Peers In 2024
Stockcharts.com
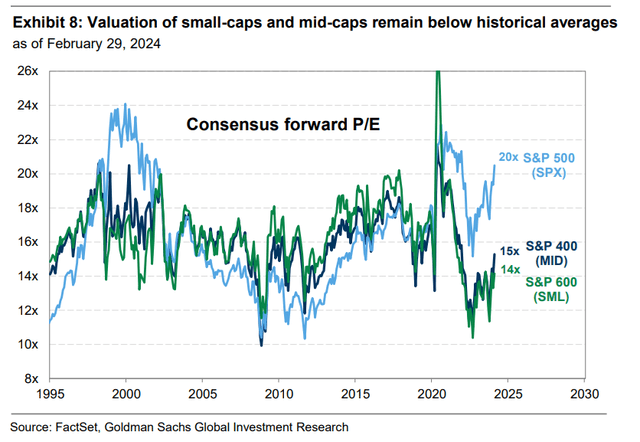
US Equity Valuations By Market Cap Size
Goldman Sachs
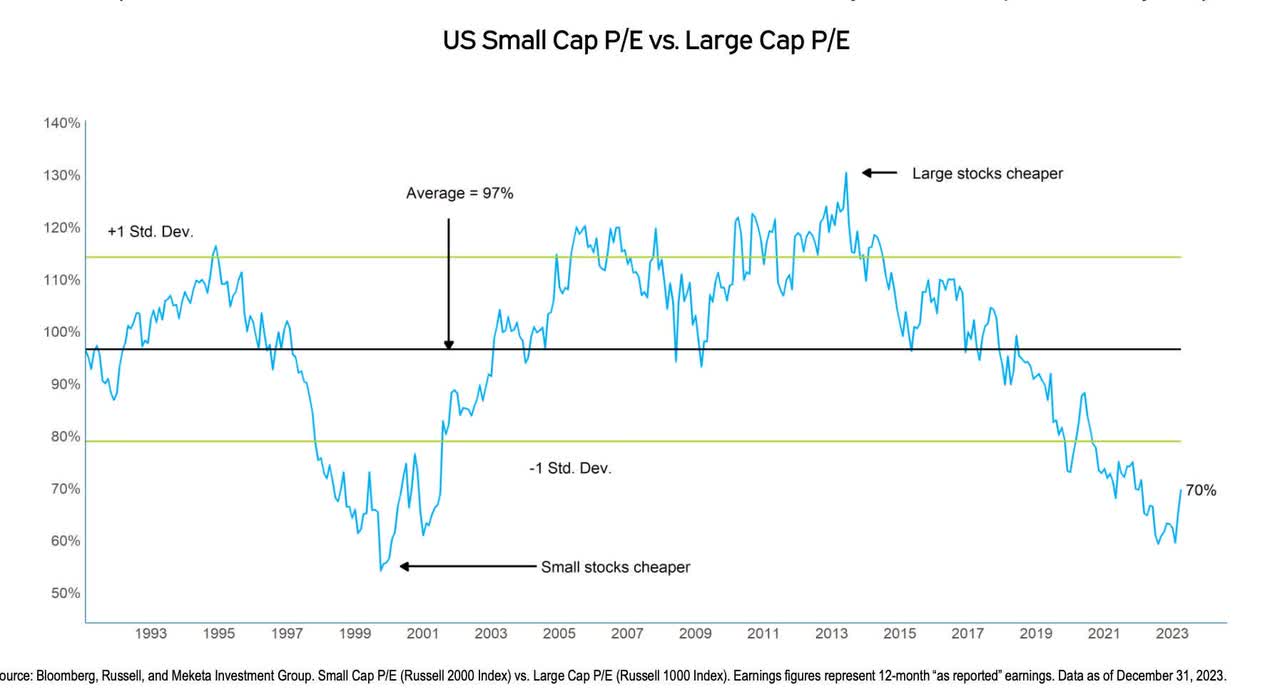
US Small Caps Still Relatively Cheap
Meb Faber
According to the issuer, IJR seeks to track the investment results of an index composed of small-capitalization U.S. equities. The low-cost and tax-efficient ETF offers investors exposure to the S&P SmallCap 600 Index and can be used as a core portfolio holding for long-term growth purposes.
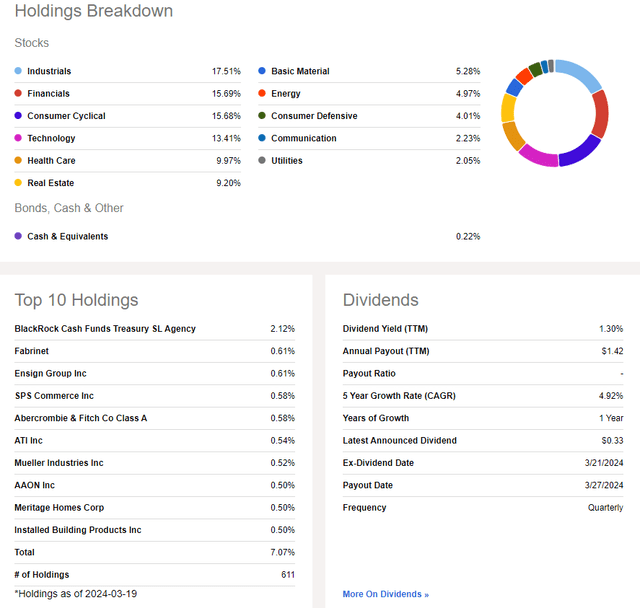
IJR is a very large ETF with $79 billion in assets under management. It pays a small yield of just 1.3% while its share-price momentum has stalled this quarter after being robust toward the tail end of 2023. Still, the fund earns a top-notch A+ ETF Grade when it comes to its annual expense ratio, though risk ratings are less than stellar care of a high trailing historical standard deviation and annualized volatility compared to other ETFs. But with high liquidity and average daily volume, investors should feel confident about IJR’s tradeability – its 30-day median bid/ask spread is just a single basis point.
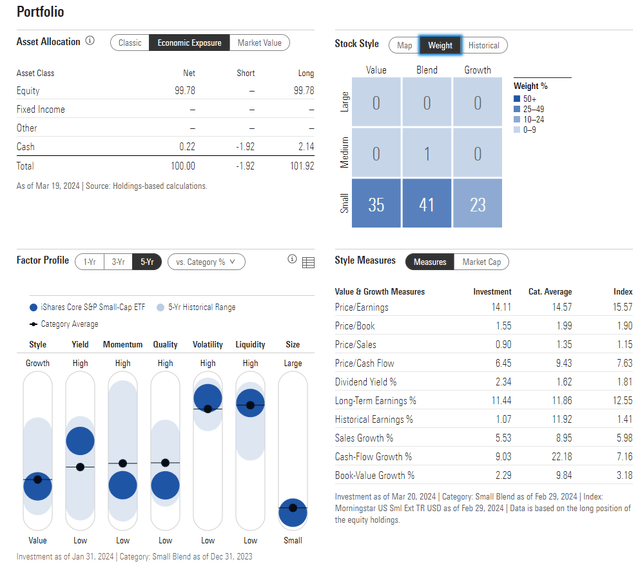
Looking closer at the portfolio, the 4-star, Silver-rated by Morningstar fund plots expectedly along the lowest tier of the Style Box. Prospective investors should be aware that the S&P SmallCap 600 Index has a value tilt given high exposure to areas such as regional banks and other small financial institutions. That being said, with just a 14.1 price-to-earnings ratio and long-term earnings growth north of 11%, the PEG ratio is quite compelling at just 1.23.
Among IJR’s most pronounced risks is that there’s ample cyclical exposure, so a downturn in the domestic economy would be particularly bearish for the portfolio. At the same time, lower interest rates could be a boon – we have seen “Goldilocks” developments on the macro front which has actually hurt IJR’s relative strength as it has come alongside a “higher for longer” interest rate paradigm.
IJR: Portfolio & Factor Profiles
Seeking Alpha
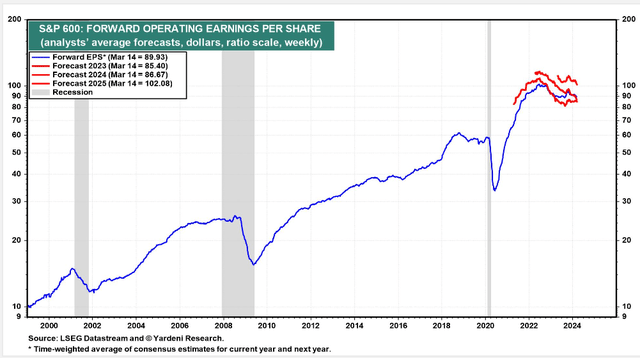
In terms of the earnings trajectory, the SmallCap 600 Index actually had peak EPS expectations about two years ago. I would like to see a definitive earnings recovery, though once that becomes apparent, I presuppose that IJR’s earnings multiple will have already increased significantly.
S&P SmallCap 600 EPS Forecasts Are Stagnant
Yardeni
As mentioned earlier, Financials comprise a significant weighting in the ETF. Industrials and Consumer Discretionary, other risk-on and economically sensitive niches, are material sector weights, too. Since the Information Technology sector is just 13% of the ETF, expect returns to continue to be different than those on the S&P 500.
IJR: A Diversified Portfolio, Low Yield
Seeking Alpha
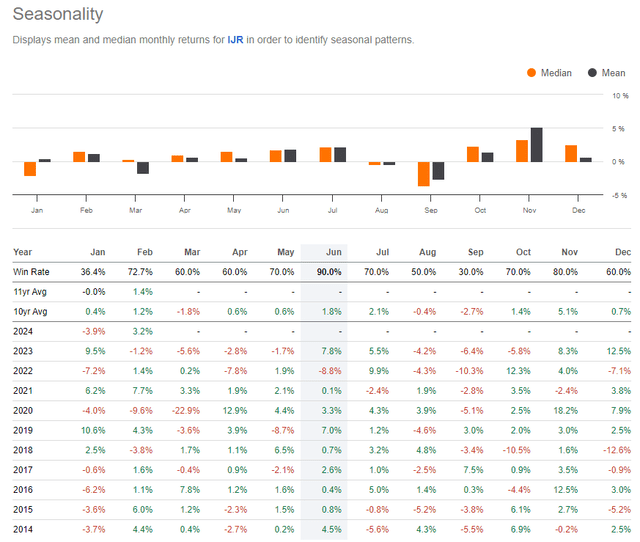
Seasonally, IJR tends to perform well from April through July. The historical seasonal script has played out more consistently this year than for the SPX, so I’d put a higher weight on such trends for small caps going forward.
IJR: Bullish Q2 Seasonality Ahead
Seeking Alpha
The Technical Take
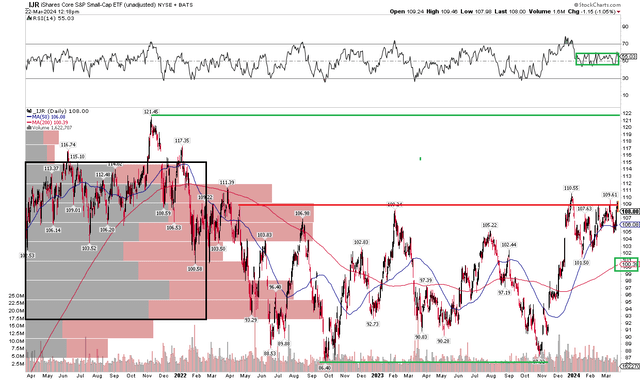
IJR’s chart continues to frustrate the bulls. Notice in the graph below that shares attempted to break out above the $108 spot toward the end of last year, but shares remain under that December peak. Moreover, there is a high amount of volume by price from near $90 to about $115 – that marks a bit of a no man’s land for the bulls and bears. Additionally, the RSI momentum gauge at the top of the chart has been confined to a narrow zone between 40 and 60 – another sign that there is a lack of a trend. In the bulls’ corner, though, is the long-term 200-day moving average – it is positively sloped which augers well for a potential upside breakout and rally back toward the all-time high just above $121.
From a price-target perspective, we can take the range low of $86 and the high near $108 to project a possible upside objective. That $22 height, added on top of the range, yields $130. So, there’s juice there if we can see a solid breakout. For now, the technicals are mixed and relative weakness to large caps remains a headwind.
IJR: Still Waiting on the Breakout, Neutral RSI Trends
Stockcharts.com
The Bottom Line
I have a buy rating on IJR. Its low valuation, bullish seasonals, and exposure to growing segments of the economy are bullish points. Its chart is more mixed, and I would like to see a more impressive breakout from a price-action viewpoint.
Credit: Source link