

AerialPerspective Works
Investors in leading Manhattan office landlord SL Green Realty Corp. (NYSE:SLG) have seen its stock recover remarkably since my previous update (Buy rating) in January 2023. I had already assessed that its price action and valuation were constructive, as the market reflected significant pessimism in the office properties market.
Office REITs like SLG had already experienced a severe hammering by the market at the start of 2023. However, when the regional banking crisis erupted in March, the market had other ideas.
As such, SLG fell further to lows not seen since early 2009, marking a massive capitulation signal in March 2023. As such, the recovery from SLG’s peak pessimism has been swift, as SLG buyers bought aggressively, given its “dirt-cheap” valuation then. Therefore, SLG has recovered all its March losses and more, with its recent price action re-testing levels in early February 2023.
As such, I believe it’s timely to assess whether buyers who missed buying SLG’s March capitulation should jump on the bandwagon now. Before that, let’s discuss whether the recovery in SLG makes sense.
The regional banking crisis has not worsened, even though it remains under stress. Oaktree Capital Management co-chairman and co-founder Howard Marks warned that he “anticipates that more companies will default on their debt due to higher interest rates.”
However, SL Green’s Q2 earnings call in July suggested that the company remains well-positioned to navigate the ongoing challenges. Its occupancy level remains well above the market average and is expected to improve further. As the US economy is not likely to fall into a hard landing, I don’t expect things to be worse than we saw in the first half of 2023. Despite that, a higher-for-longer Fed positioning would be expected to place further pressure on highly leveraged REITs like SL Green. Analysts’ estimates suggest that SL Green’s adjusted EBITDA leverage ratios are expected to rise to 10.8x in FY24.
As such, the company would likely not have significant firepower to execute generous stock repurchase programs. Instead, I expect the company to utilize asset disposals to pay down debts and improve its balance sheet.
The company remains committed to maintaining its dividend per share, emphasizing it manages its distribution based on net income and not adjusted FFO or AFFO. However, I believe the forward dividend yield of 8.3% is still pricing in risks of a cut, although it has yet to materialize. As such, the market would likely continue to reflect a significant discount against its average valuation to account for the stress levels on SL Green’s ability to sustain its dividends. Furthermore, with the 10Y Treasury yield still printing at 4.2%, it’s unrealistic to expect the market to re-rate SLG upward toward its 10Y forward dividend yield average of 4.46%.
Despite that, analysts’ estimates suggest the worst is likely over, indicating that SL Green should perform more favorably in FY24. Accordingly, SL Green is expected to post a nearly 30% decline in FFO per share in FY23. However, it’s expected to inflect back into growth in FY24, increasing by 1.6%. While it isn’t significant, it suggests that things aren’t likely to worsen for investors who bought at SLG’s March 2023 lows.
Therefore, it should provide a clear path toward SLG’s normalization of its well-battered valuation if the Fed cuts rates earlier than expected (potential upside surprise). However, the recent recovery appears to have hit a roadblock, suggesting investors should consider waiting for the next pullback before adding further. Let’s take a look.
SLG price chart (2-Day) (TradingView)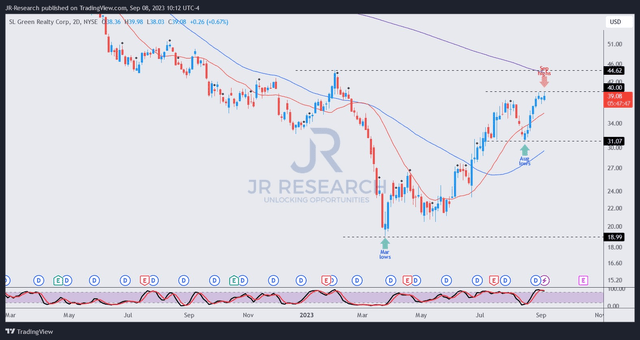
SLG formed its August lows in the recent pullback before surging to re-test the $40 level. However, its upward momentum has stalled, suggesting caution. Also, it has inched closer to a critical resistance zone at the $44 level, which could attract more selling pressure. I expect short-sellers to use that level to reload their positions, intensifying selling pressure.
As such, I assessed that buyers looking to partake in SLG’s medium-term recovery consider holding back first while observing the resolution of the recent resistance levels. Buyers can consider adding if the next pullback can be supported above the $31 level.
Rating: Downgraded to Hold. Please note that a Hold rating is equivalent to a Neutral or Market Perform rating.
Important note: Investors are reminded to do their due diligence and not rely on the information provided as financial advice. Please always apply independent thinking and note that the rating is not intended to time a specific entry/exit at the point of writing unless otherwise specified.
We Want To Hear From You
Have constructive commentary to improve our thesis? Spotted a critical gap in our view? Saw something important that we didn’t? Agree or disagree? Comment below with the aim of helping everyone in the community to learn better!
Credit: Source link