
mbbirdy/iStock via Getty Images
The reshuffling of weightings in the popular Invesco NASDAQ 100 ETF (QQQ) during late July pushed the positioning of Apple (AAPL) and Microsoft (MSFT) lower in particular. It also has some traders looking for ways to gain exposure to the Big Tech sector through different investment vehicles.
Perhaps the best, lowest management-cost way (0.10% in annual fees) to play the two largest companies on Wall Street, with capitalizations approaching $3 trillion each, using one trade decision is through the Technology Select Sector SPDR (NYSEARCA:XLK). If you are bearish on the top two stocks in America by market size like I am, because price/valuations appear stretched vs. weakening operating growth rates, while rising bond yields may be better alternatives for investment capital, this unique security may be a possible Short target for you.
ETF Weightings
XLK today overweights the two giants vs. peer companies in the Big Tech sector. Apple and Microsoft now account for roughly 45% of total positioning in this highly-liquid ETF with $49 billion in assets under management.
Below is a table of the Top 10 holdings in QQQ as of August 8th, 2023. This group accounted for 48% of the ETF design a few days ago, although many of the Top 5 are “underweighted” now vs. their actual market-cap sizes.
Seeking Alpha Table – QQQ, Top 10 Holdings, August 8th, 2023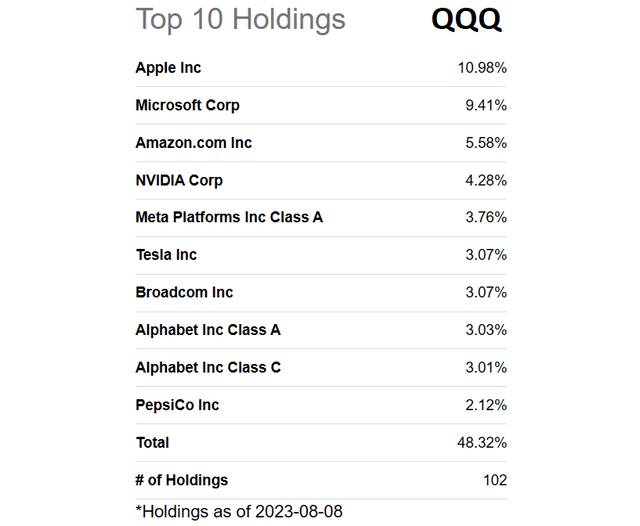
The Technology Select Sector SPDR’s Top 10 holdings are similar, but actually substantially overweight Apple and Microsoft. The group of 10 represented a heavy 69% of the whole fund design, on August 8th. In addition to Apple and Microsoft, NVIDIA (NVDA), Broadcom (AVGO), Adobe (ADBE), Cisco (CSCO), Salesforce (CRM), Accenture (ACN), Advanced Micro Devices (AMD), and Oracle (ORCL) are the names included.
Seeking Alpha Table – XLK, Top 10 Holdings, August 8th, 2023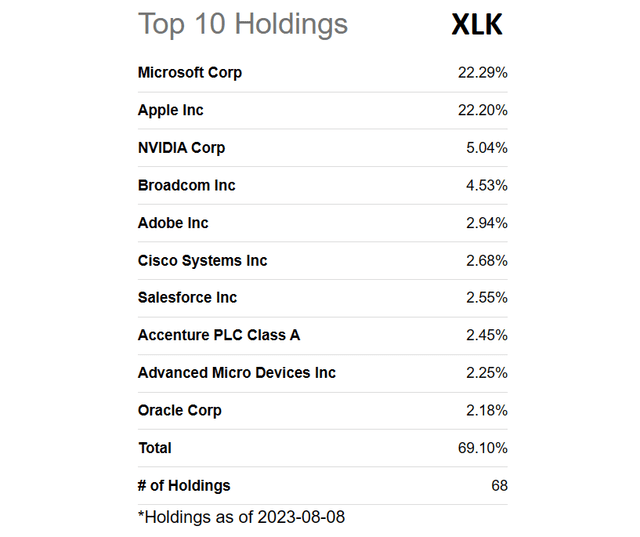
Reasons to Consider Short Position
On my part, I have ratings and/or outlooks of Neutral to Sell on the vast majority of U.S. Big Tech names currently, following the monster +40% price upmove in the sector since December. So, logically now may be a great time to consider shorting the XLK product as a hedge in your portfolio. If we get a recession with falling operating income next year, Big Tech valuations are completely out-of-whack compared to the “risk-free” Treasury yields of 5% available today.
In traditional economic textbooks written before the original Tech boom of the late 1990s, risk-free returns were considered a bare minimum hurdle before investing, for free cash flow and earnings yields at slower-growth enterprises.
Below I have graphed trailing earnings yields for XLK’s Top 10 holdings. You will notice each is now generating earnings/price well below the 5.35% 1-year Treasury yield available to everyone that invests. In contrast, a year ago 5 of the 10 were spitting out earnings (on the share price) to owners at a rate ABOVE 1-year “risk-free” securities. [Note the stocks and Treasury instrument are using slightly different scales on the graph].
For the two largest holdings, Apple’s trailing earnings yield is currently 3.34% and Microsoft’s is 3.00% for new buyers and holders of each stock. If these choices were high-growth ideas, an argument could be made that low earnings yield over the next year are acceptable, as a company can grow into much higher investment return numbers over a few years. The problem is a recession could send weaker growth since 2021 at nearly all Big Techs, into negative/contraction territory by 2024.
YCharts – Top 10 Big Tech Holdings of XLK vs. 1-Year Treasury Rate, Trailing Earnings Yield, 1 Year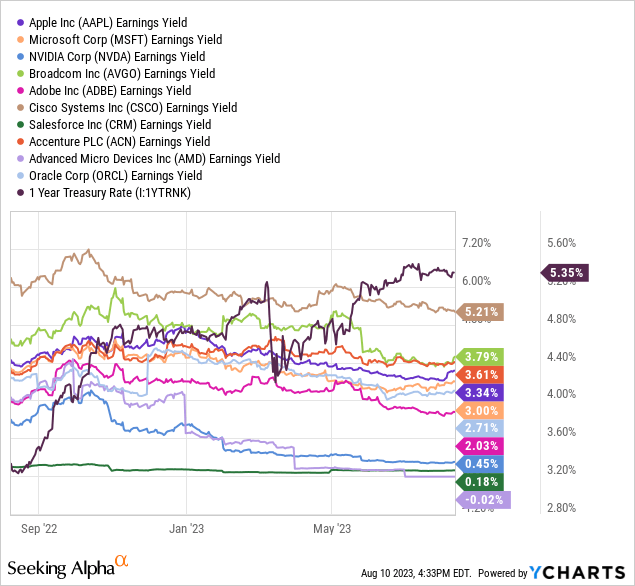
Even, if we look forward to analyst estimated earnings into early 2024, only Cisco may deliver a stronger business return on investment vs. shorter-term Treasuries, using our earnings yardstick of measurement. Both Apple and Microsoft are priced similarly today with a 3.4% forward earnings yield.
YCharts – Top 10 Big Tech Holdings of XLK, Forward Earnings Yield, 1 Year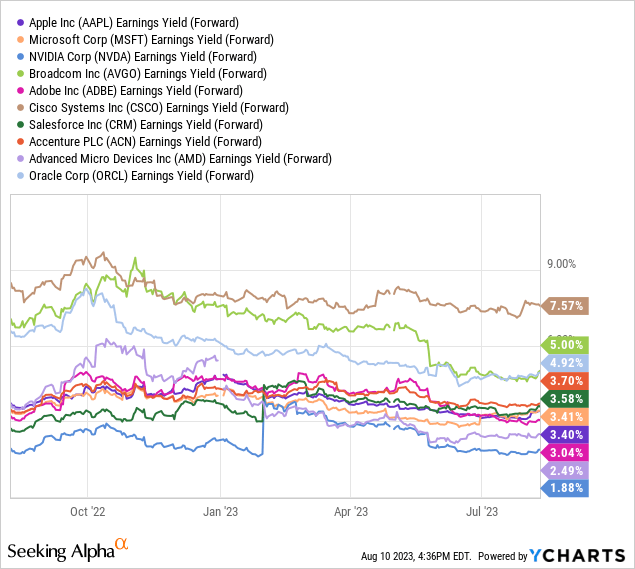
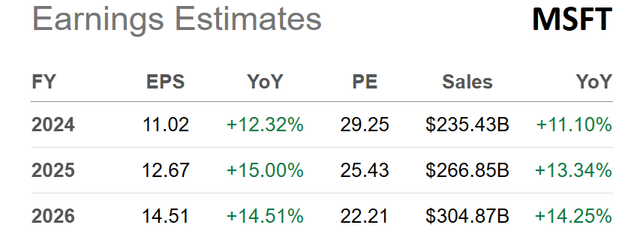
The main fundamental business problem for both Apple and Microsoft is growth today is not the same as 5 or 10 years ago. They are so massive, new products (VR headsets for Apple) and initiatives (ChatGPT for Microsoft’s Bing search) barely move the needle. Below are tables of analyst estimates for stagnating Apple results, with annual growth rates of 6% to 9% near the 3% to 4% pace of general inflation in the economy, alongside Microsoft’s somewhat better expected results in the 10% to 15% area. Neither entirely supports 3% earnings yields going into a recession, in my view.
Seeking Alpha – Apple, Analyst Estimates for 2023-25, Made August 10th, 2023 Seeking Alpha – Microsoft, Analyst Estimates for FY 2024-26, Made August 10th, 2023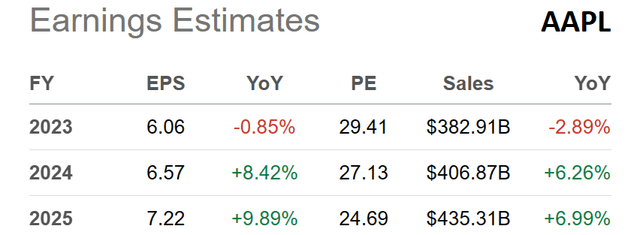
Lastly, immediate cash distributions (dividends) have moved from super-positive settings relative to money-market yields in late 2020 and early 2021 to lagging badly rates today. I have charted below trailing cash yields (on the prevailing share price) vs. the Vanguard Treasury Money Market Investor (VUSXX) since the middle of 2020. The XLK average of 0.80% today, Apple number of 0.39% and Microsoft rate of 0.63% are quite a distance from the simple and all-but-guaranteed Vanguard mutual fund yield of 3.94%. More importantly, owning money markets, you don’t have to worry about the real-world risk of losing 100% of your upfront capital, like a regular equity security investment.
YCharts – Top 10 Holdings of XLK vs. Vanguard Treasury Money Market, Trailing Dividend Yield, 3 Years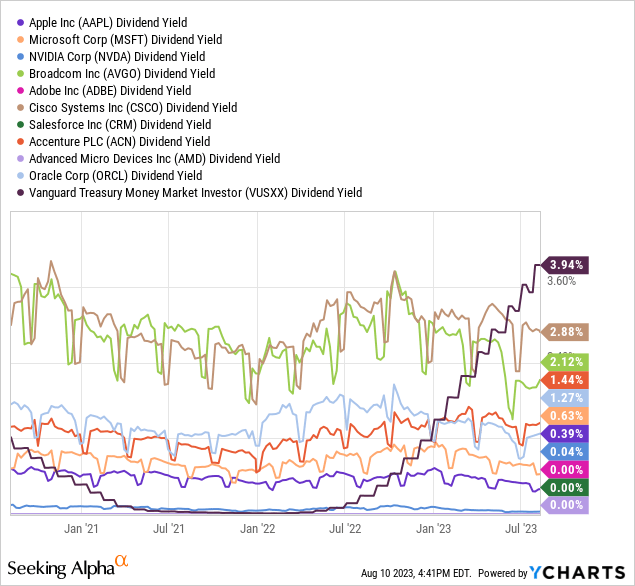
Final Thoughts
It appears Apple and Microsoft have begun to lag the overall NASDAQ 100 index since early summer. Below is a 3-month total return graph comparing the two against the NASDAQ 100 index.
YCharts – Apple & Microsoft vs. NASDAQ 100, Total Return Performance, 3 Months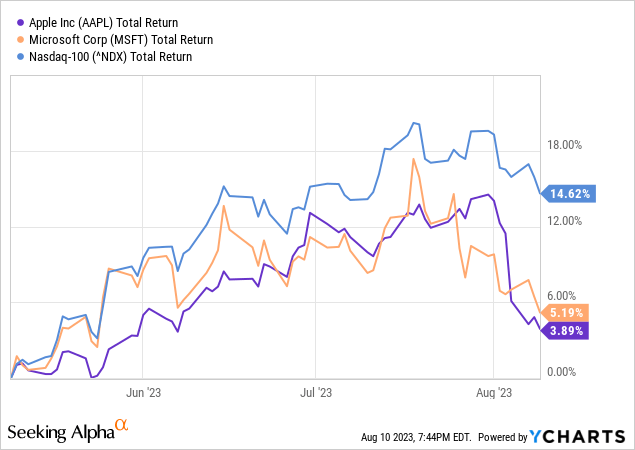
Reviewing a 12-month chart of daily price and volume changes in the XLK product, we can see price has dipped under the 50-day moving average for the first time since early January. Performance has turned lower from the overweighting of lagging Apple and Microsoft shares. Plus, the 20-day Chaikin Money Flow and 14-day Ease of Movement indicators are highlighting the greatest level of selling in seven months.
StockCharts.com – Technology Select SPDR, 12 Months of Daily Price & Volume Changes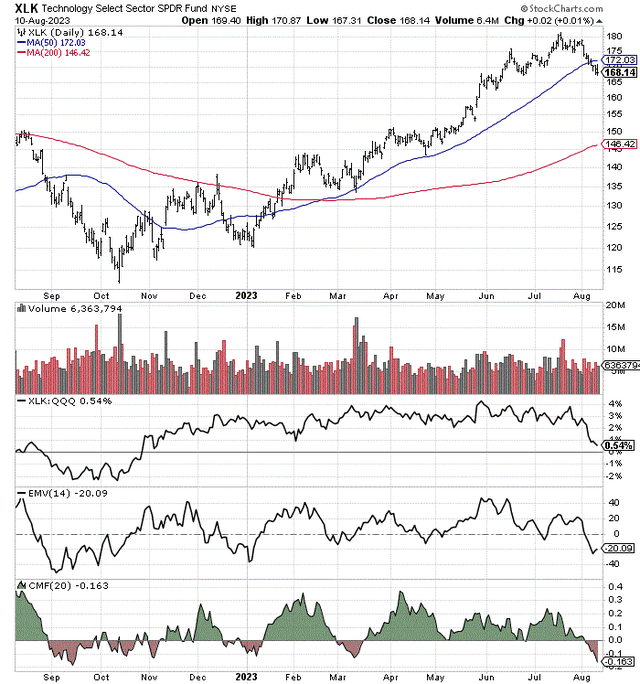
My trading conclusion: if a bear market returns to Wall Street while a recession drags down corporate profitability, holding Big Tech shorts in this overvalued and sizzling-hot sector for investor sentiment in August, could be the most intelligent position to take for the rest of the year.
Even if we avoid recession and experience some sort of soft landing, fully-priced Big Tech names could still correct substantially from slight projected 2024 business growth and amazingly-competitive 5% Treasury yields.
For my money, looking to short the two largest Big Tech names with easily understood overvaluations and sliding growth prospects is an idea to seriously consider. You can use the Technology Select Sector SPDR ETF to accomplish this goal, which may underperform both the regular QQQ ETF design and the S&P 500 index generally into the end of the year.
I rate XLK a Sell for a 12-month outlook, especially when paired as a short position against other stocks in your portfolio with brighter growth prospects and stronger valuation arguments.
Thanks for reading. Please consider this article a first step in your due diligence process. Consulting with a registered and experienced investment advisor is recommended before making any trade.
Credit: Source link