
DNY59
If the markets were to close 2023 today, the S&P 500 Index would have delivered 25% returns, placing it as one of the best years in history following last year’s -18.2% poor returns.
Given the market’s rapid rise in the past few weeks, investors may be tempted to ‘hedge’ their gains with an inverse ETF like the ProShares UltraShort S&P 500 ETF (NYSEARCA:SDS). My short recommendation is don’t!
A more nuanced take is that while in the short-term, markets are extremely overbought and due for a pullback, inverse ETFs like SDS are a bad long-term investment as it suffers from serious volatility decay. A smarter choice for investors may be to trim their long holdings if they are afraid of a market correction, instead of using levered inverse ETFs.
Fund Overview
The ProShares UltraShort S&P500 seeks daily returns that are -2x the return of the S&P 500 Index (“Index”). The goal of the SDS ETF is to help investors profit from a market decline and to help hedge against expected declines.
The SDS ETF achieves its levered return by entering into total return swaps with the large investment banks that are reset nightly (Figure 1). It also holds collateral in the form of treasury bills.
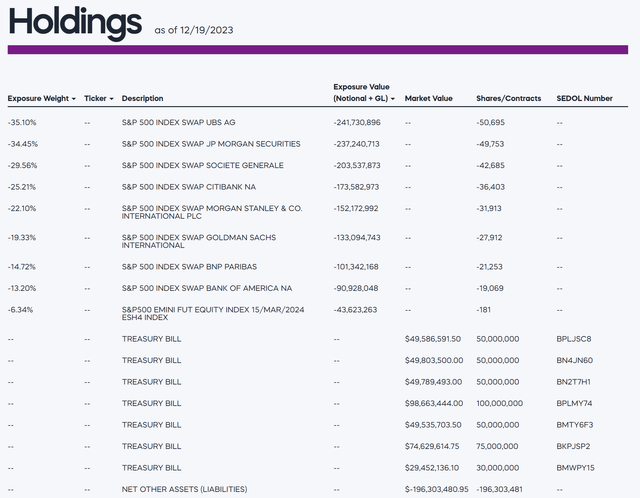
Figure 1 – SDS holds total return swaps against large investment banks (proshares.com)
Investors interested in the SDS ETF are highly encouraged to read this disclaimer from the ProShares website, as well as consult these warnings from FINRA and the SEC (Figure 2).
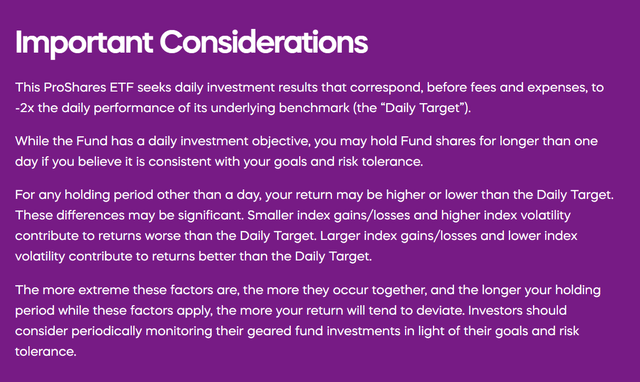
Figure 2 – Important disclaimer on levered ETFs (proshares.com)
Don’t Hold This ETF For Long
Whatever investors decide to do, the most important thing to remember with the SDS ETF is that it should not be held for the long-term, as the fund’s strategy is only designed to work on very short time horizons, for example a few days. When we start to look beyond the 1-day horizon, volatility and convexity will start to introduce tracking error to the SDS ETF.
Numerically, if we started off with $100 invested in SDS, if the S&P 500 Index fell 5% on day 1, our position will grow to $110 (2 times 5% return). If the index fell 5% again on day 2, the position will grow to $121.00, more than twice the theoretical 2-day compounded return of 10.25% or $120.50.
Conversely, if the index returns were consecutive 5%, then the initial investment will end up at $81.00, versus a two times the 2-day compounded loss of 9.75% or $80.50.
This tracking error in the SDS ETF is called ‘positive convexity’ and refers to the fact that the exposure from holding levered ETFs like SDS grows as the bet is winning.
On the other hand, if the return profile is -5% followed by +5% on the S&P 500 Index, investors end up with $99.00, significantly less than twice the 2-day compounded loss of 0.25% or $99.50. This component of tracking error is called ‘volatility decay’.
While these tracking errors may seem small on a day-to-day basis, when measured over long time periods, they can lead to very significant differences between expected and realized returns.
For example, even though the SPDR S&P 500 ETF Trust (SPY) lost 18.2% in the 2022 bear market, the SDS ETF only gained 30.7% (Figure 3). This means the decay subtracted almost 6% from total returns.
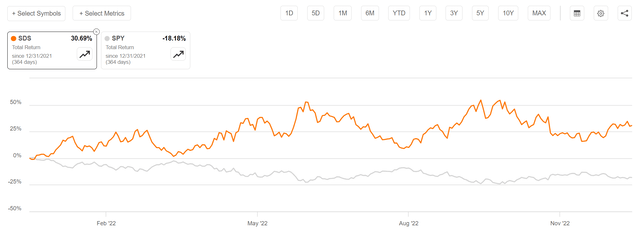
Figure 3 – SDS experiences significant tracking error (Seeking Alpha)
Inverse Market ETFs Lose Value Over The Long-Term
Furthermore, volatility coupled with the fact that markets are upwards trending means that inverse ETFs like the SDS are almost guaranteed to lose money over the long-term. For example, if we look at the SDS’s historical performance, we can see that outside of brief periods, the SDS ETF has lost money on all time frames, from -16.4% on a 1 year basis to -25.0% p.a. for 10 years (Figure 4).

Figure 4 – SDS historical returns (proshares.com)
In fact, if investors had bought the SDS ETF at inception on July 11, 2006, they would have lost 99.3% of their money vs. a 431% gain in the SPY ETF!(Figure 5).
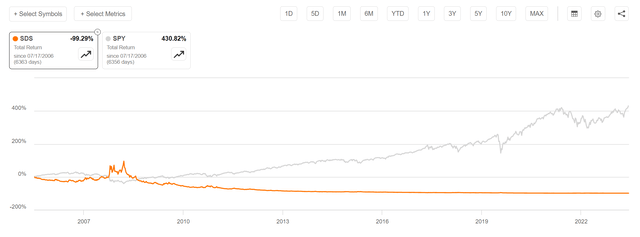
Figure 5 – Taken to extreme, SDS investors from day 1 would have lost 99.3% of their money! (Seeking Alpha)
Markets Extremely Overbought In The Short-Term
That is not to say inverse ETFS cannot make money for nimble traders. As we mentioned at the beginning of this article, risk assets have gone virtually straight up since the beginning of November as investors anticipate the Federal Reserve nearing the end of the current rate hiking cycle. On many technical measures like RSI, the S&P 500 Index is the most overbought in the past few years (Figure 6).
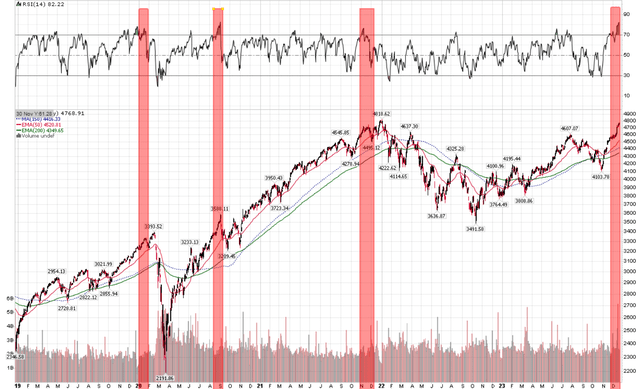
Figure 6 – S&P 500 Index extremely overbought (Author created with price chart from stockcharts.com)
Historically, short-term returns have been poor when markets are this overbought so nimble traders may be able to use the SDS ETF to bet on a correction.
However, one word of caution is that if the market do correct as anticipated, SDS traders should monetize their winnings quickly.
Conclusion
If investors are truly concerned about markets being overbought, they should consider reducing their long exposures instead of seeking inverse ETFs like the SDS as a hedge. This is especially true for holding periods longer than a few days due to the volatility “decay” from daily rebalancing.
While nimble traders can try to capitalize on the convex nature of levered ETF returns, if they happen to have unrealized gains from correctly timing the markets, they should take their winnings and run. I rate the SDS ETF a long-term sell.
Credit: Source link