
JHVEPhoto
Investment Thesis
Royal Bank of Canada (NYSE:RY) is a solid bank with a conservative risk profile trading at an undervalued stock price. When we take a closer look at the business, its net interest margin is slightly lower than its peers however RY makes up for it by having a very solid net charge off ratio, which shows their dedication to high quality loans and excellent credit risk management. RY also knows how to leverage their assets resulting in outsized returns on equity. Additionally their efficiency ratio consistently stays below 60% indicating control, over costs and setting them apart from their competitors in terms of operational efficiency. With the current valuation projecting an expected annual return of 15.5%, RY seems to me like a buy.
Headline Financial Analysis
Throughout the past decade, Royal Bank of Canada has produced slow and steady revenue growth increasing from $26,143.02 in 2015 to $38,695.23 in 2023, exhibiting a compound annual growth rate in the region of 4.0%. Given that analysts expect revenue of $42,030.00 for 2024, I consider this rate of revenue growth to be sustainable and in line with historical growth rates and future revenue growth expectations.
Created by Author, Data from WiseSheets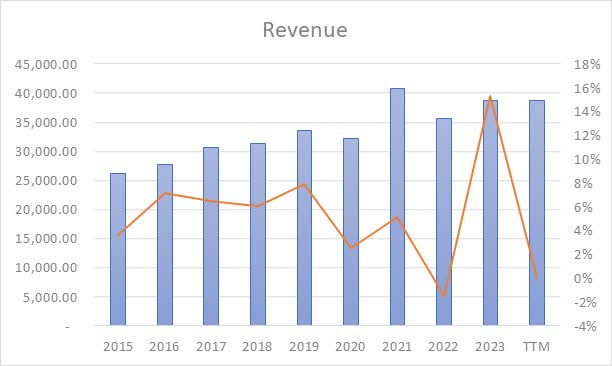
I view earnings per share throughout the previous 10 years as having been slow, where EPS went from $5.14 in 2015 to $7.57 in 2023, exhibiting a compound annual growth rate in the region of 3.9%. Analysts project that in 2024 EPS is anticipated to land at $8.67 denoting that EPS growth will be 14.5% YOY.
Created by Author, Data from WiseSheets
Net Interest Margin
Let’s now focus on net interest margin. I feel that when evaluating the net interest margin, it is important to scrutinize the quality of loans that the bank possesses on its balance sheet. Royal Bank of Canada The Royal Bank of Canada (RY) has a business model that includes a significant chunk of its earnings coming from Personal & Commercial Banking.
RY Investor Presentation Q4 2023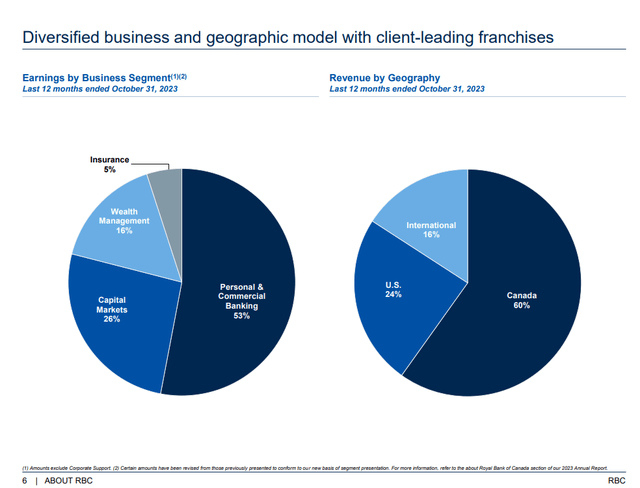
This segment represents 53% of its earnings in the 12 months ending on October 31 2023. Other notable segments are Capital Markets contributing to 26% of earnings and Wealth Management accounting for 16%. This distribution suggests that while RY has a noteworthy amount of earnings coming from capital markets and wealth management services, though the majority of its earnings still come from banking operations. These operations encompass loan types such as mortgages, personal loans and business loans. In terms of geographical revenue distribution RY generates 60% of its revenue from Canada, followed by 24% from the U.S., then the remaining 16% comes from other international regions.
Created by Author, Data from WiseSheets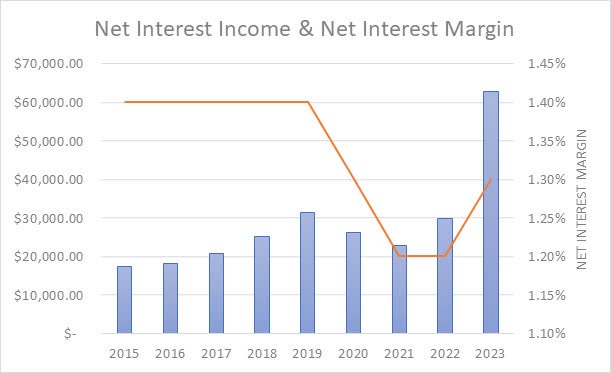
Royal Bank of Canada has attained a median NIM over the past decade of 1.4%. Upon contrasting RY’s decade-long net interest margin against that of its main competitors shows that Citigroup (C), JPMorgan (JPM), and Bank of America (BAC) all maintain a ten-year median NIM of 2.4%, 1.8%, and 1.9%, respectively. This places RY as having the fourth highest ten-year median net interest margin. While RY’s NIM is low on the surface level, we must also consider the amount of leverage the bank is using as well as the net charge off ratio. Since the net charge off ratio is low and the leverage is quite high, this helps offset the low net interest margin.
Created by Author, Data from WiseSheets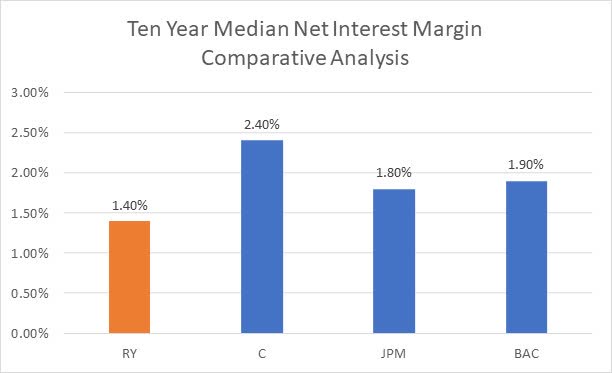
I feel an additional significant factor to observe is the uniformity of the net interest margin. A uniform net interest margin is generally indicative of better loan quality, whereas a more volatile NIM often suggests lower loan quality, rendering the bank’s future performance harder to predict and increasing uncertainty. Regarding RY, the standard deviation of the ten-year NIM is 0.00087, which categorizes it as having the lowest standard deviation of the net interest margin within its peer circle. Therefore, in my opinion, this shows that RY in recent times this company has shown efforts, in keeping its net interest margins stable when compared to the other banks. This indicates more stable performance which should make it easier to more reliably forecast.
Created by Author, Data from WiseSheets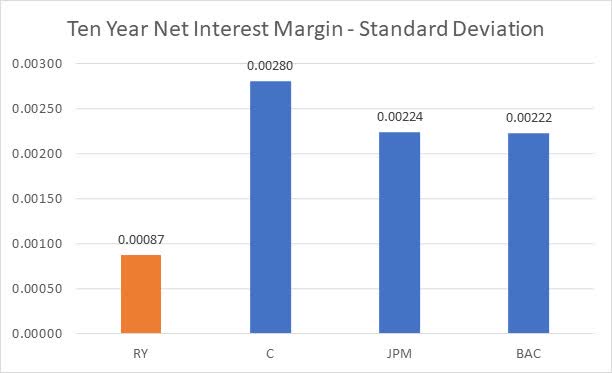
Net Charge-Off Ratio
In my mind, a vital metric in assessing the quality of the loan book is the net charge-off ratio. As revealed in the data that follows, across the past ten years RY has observed their net charge-off ratio ranging between 0.20% and 0.10%. In each of the last ten years, RY has had a lower NCO ratio than the industry averages every year. This indicates healthy credit practices and effective risk management practices over these years.
Created by Author, Data from WiseSheets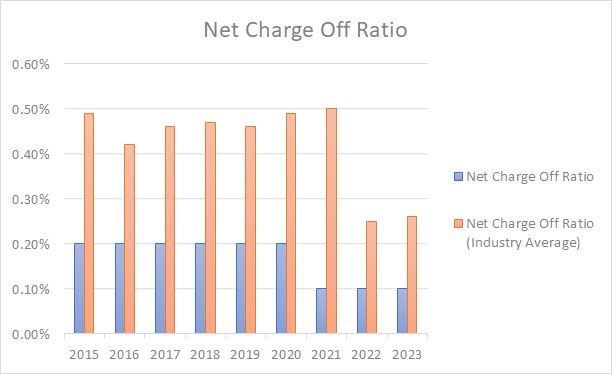
While contrasting RY’s decade-long average net charge-off ratio alongside its peer group, we can notice that C, JPM, and BAC each possess a ten-year median NCO ratio of 1.10%, 0.50%, and 0.40%, accordingly RY is rated first within this assessment. In my point of view, given that RY has a historic ten-year median net charge-off ratio of 0.20%, My perspective is that RY is well positioned to achieve acceptable net interest margins given the low level of risk that their loan book presents.
Created by Author, Data from WiseSheets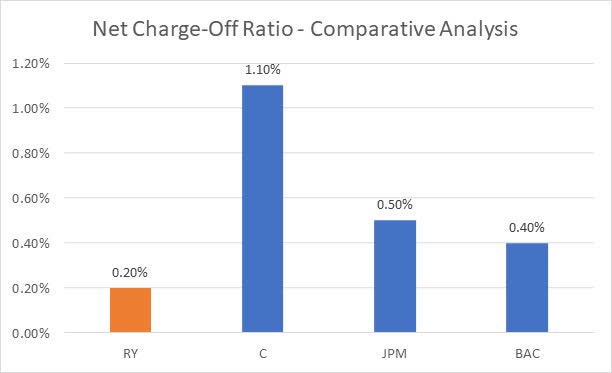
Leverage
When assessing the balance sheet risk of banks, I find leverage to be a valuable tool. In particular, I emphasize that the assets to equity ratio is a key contributor to future return on equity. Concerning my broad standpoint, I consider higher leverage acceptable as long as net charge-offs are minimal; in contrast, I advocate for lower leverage if the bank ventures into riskier loans like personal credit, construction loans, and auto loans. With respect to Royal Bank of Canada, it has consistently held a decade-long median asset to equity ratio of 17.0, indicating what I would consider a pretty high level of leverage for a large bank such as Royal Bank of Canada, though in my opinion this amount of leverage is manageable due to RY’s low net charge off ratio. In 2018 the assets to equity ratio peaked at 18.72. After reaching its peak the ratio gradually stabilized around the 17 mark with the most recent figure reported at 17.03. Overall, as long as RY maintains their prudent lending approach that focuses on loan risk management and maintains a low net charge off ratio, I think leverage remains under control.
Created by Author, Data from WiseSheets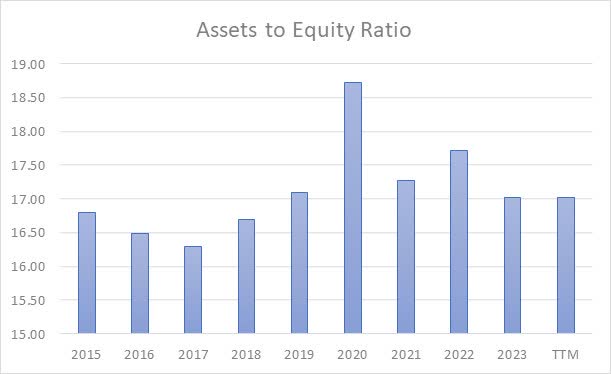
In my observations, Royal Bank of Canada has the highest degree of leverage in comparison to its peers, and taking into account that RY also has a better than average net charge-off ratio, this indicates that the management team are capable of managing balance sheet risk while simultaneously maintaining driving higher than average returns on equity through higher levels of leverage.
Created by Author, Data from WiseSheets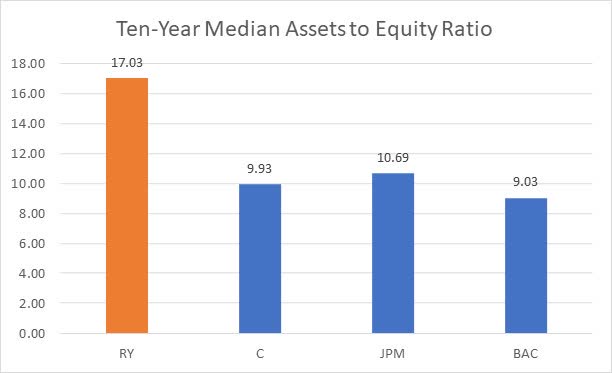
Efficiency Ratio
In my opinion, the efficiency ratio is a key metric for showing the effectiveness of banks in managing their overhead costs, where a sub-60% efficiency ratio is seen as above standard in the banking industry. As we can see Royal Bank of Canada in 2015 had an efficiency ratio of 43%. Since 2015, the efficiency ratio has been very consistent ranging between 40% and 49% with some ups and downs in between. In the LTM it appears that the ratio stabilized at around 47%. Since 2015, RY has been successful in tallying a total of ten years of which the efficiency ratio was consistently below 60%, and reaching a median efficiency ratio for the decade of 45%. This shows that the banks management team have done an excellent job in minimizing overhead expenses that would otherwise eat into net income margins.
Created by Author, Data from WiseSheets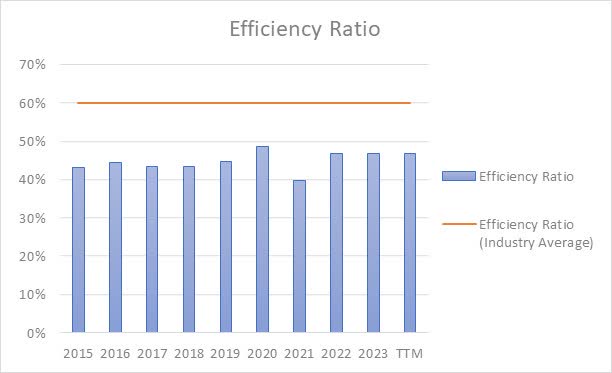
As we compare RY’s ten-year median efficiency ratio in comparison to its counterparts, it is clear that C, JPM, and BAC each exhibits a ten-year median net charge-off ratio of 61%, 62%, and 65%, accordingly RY is positioned lowest among its counterparts. As I see it, when set against the backdrop of other similar banks, the management team has demonstrated that they have done an effective job at managing overhead costs at the bank.
Created by Author, Data from WiseSheets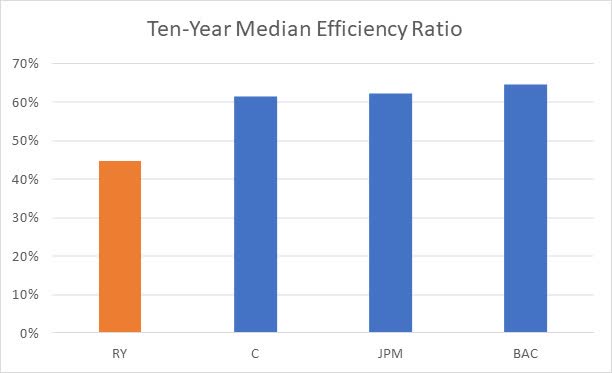
Deposits and Funding Sources
Based on my understanding it is crucial to examine how banks manage their deposits and funding strategies in order to understand the cost structure of these deposits and the likelihood of them being retained long term. I often like to observe the loan to deposit ratio; optimally, this should stay below 100%, demonstrating that the bank doesn’t require more expensive funding methods. In the case of Royal Bank of Canada, over the last decade, they have successfully kept a loan to deposit ratio of under 100% in ten across the span of the last ten years. This demonstrates that the deposits side of the bank is strong and that the bank consistently has access to cheaper funding sources such as deposits within bank accounts and certificates of deposits.
Created by Author, Data from WiseSheets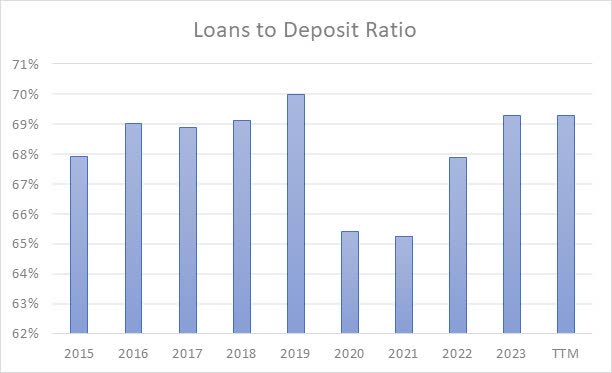
In the last 12 months, non-interest bearing deposits made up a total of 15% of RY’s total deposits where the rest of the deposits are interest bearing. It’s evident that non-interest bearing deposits as a funding source strengthens NIM. Yet, in my perspective, these deposits tend to be less stable, being short-term in nature and susceptible to customer withdrawals in pursuit of higher interest rates elsewhere. While interest-bearing deposits are costlier for banks as a funding source, these deposits tend to be more long-term and reliable. Since 2021 RY has observed a decrease of 16.1% in non-interest bearing loans which we have seen be the common trend in the banking world, triggered by elevated interest rates and a general dip in liquidity. Since this trend is industry wide and given that the bank has a strong loan to deposit ratio, I believe that the deposits and funding sources side of the business is strong.
Return on Assets and Return on Equity
Royal Bank of Canada during the previous ten years, has maintained a median return on assets of 0.9%, and have secured a median return on equity of 16.7%. The Royal Bank of Canada has consistently shown steady returns on assets (ROA) over the past decade maintaining a level close to 1.0%. While the ROA isn’t massively high, it is consistent which makes the bank’s ROE easier to forecast and when paired with high leverage, strong return on equity is found. Looking closer at ROE, we can see it consistently trends in the teens range. Starting at 18.4% in 2015 and with fluctuations it currently stands at 13.9% in the last twelve months. This reflects the bank’s stability and consistent trend with ROE in the teens range clearly indicating competence at the business.
Created by Author, Data from WiseSheets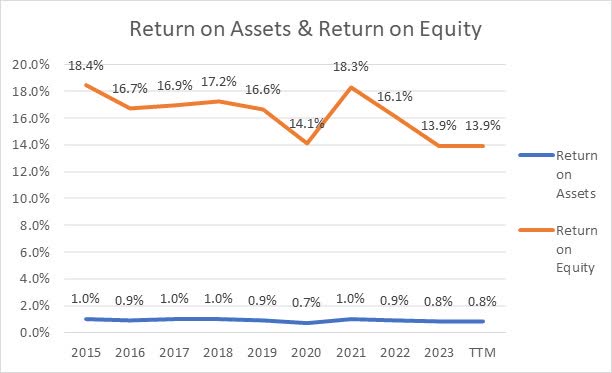
Upon comparing RY to its counterparts, throughout the recent decade, we can observe that RY has the tied second highest rate of return on assets and the first greatest return on equity. It is important to know that a higher return on equity is not always better than a lower return on equity since all depends on the banks risk profile, i.e. the amount of leverage used in confluence of the net charge of ratio. Bearing this in mind, considering that the management team has effectively managed net charge-offs, I consider the return on equity to be acceptable.
Created by Author, Data from WiseSheets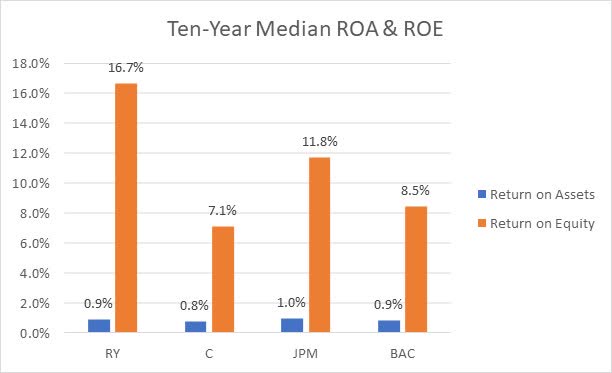
Valuation
In the process of determining valuation for Royal Bank of Canada, I have decided to apply the following conditions:
- A normalised return on assets of 0.9% which constitutes the ten-year median spanning various market conditions.
- A normalised assets to equity ratio of 17.0 constituting the ten-year median assets to equity ratio.
- A normalised ten-year median payout ratio of 46%.
- A current price to book ratio of 1.70 and a future five-year expected price to book ratio of 1.98 which is based off the ten-year median.
Created by Author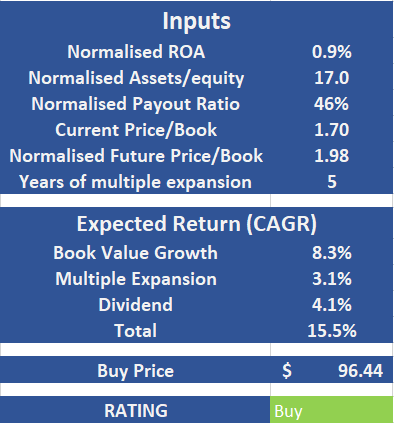
As can be seen above, I expect that Royal Bank of Canada over the next five years will return shareholders a CAGR of 15.5% of which 8.3% will come from growth in the book value, 3.1% is expected to come from multiple expansion as well as an annual dividend yield of 4.1% is projected. Therefore, I believe that Royal Bank of Canada is presently a buy when considering the current share price of $96.44.
Risks
Investing in Royal Bank of Canada like all bank stocks comes with some risks to consider. I think with RY investors need to think about the bank’s sensitivity to changes in interest rates and credit risk. When interest rates fluctuate it directly affects RYs profitability by influencing its NIM. Higher rates can potentially reduce loan demand while at the same time narrowing lending spreads. During downturns there is also an increased credit risk leading where customers have a higher likelihood of defaulting on their loan payments. With that being said, RY already excels in these areas and would likely outperform other banks when faced with tough macro environments.
Conclusion
The Royal Bank of Canada is an example of stability and effective management. While its net interest margin may be slightly lower than the average of its competitors, we can see that it compensates for this with a net charge off ratio that surpasses industry standards. This indicates RYs focus on maintaining high quality loans and proficient credit risk management. Additionally RY demonstrates balance by leveraging its balance sheet while mitigating credit risk resulting in strong returns on equity. The banks notable overhead cost management is evident through its efficiency ratio, which remains below 60% and sets RY apart, from its peers. With a valuation projecting a 15.5% CAGR, I think that RY looks to be an appealing buying opportunity.
Credit: Source link