


-slav-
The taper tantrum commencing May 21, 2013, kicked off a decade long era of public market pessimism about REITs. It was the dawn of a myth that real estate cannot handle rising rates.
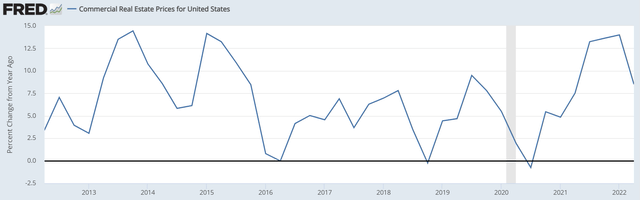
Real estate has done just fine. Commercial real estate values have roughly doubled over the past 10 years.
Graph #1: change in CRE value year over year
FRED
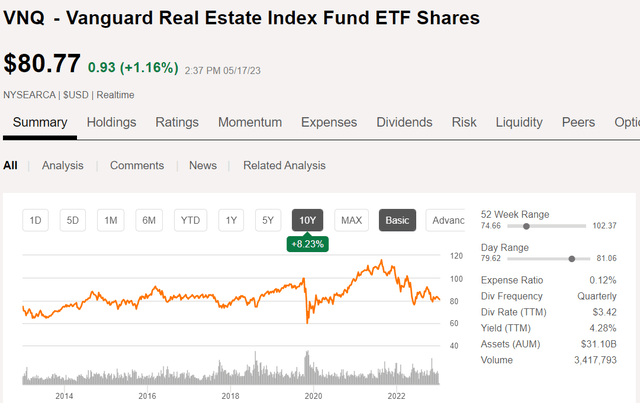
On good years real estate values increased 7%-12% and on bad years they were up 2.5%-5%. Compounded over a ten-year period, real estate values roughly doubled since the taper tantrum. Contrast this with the doom and gloom of publicly traded REITs which have had 10 years of flat returns as measured by the Vanguard Real Estate ETF (VNQ).
Graph #2 change in price of public REITs
SA
I posit that what has really happened is not interest rates hurting real estate, but rather interest rates hurting the market’s perception of real estate. There is a growing rift between the actual value of properties at which they are bought and sold by sophisticated owners and the diminished price of public REITs.
This is evident in the standard institutional valuation metrics: net asset value and earnings multiple (FFO multiple or AFFO multiple for REITs).
- The median REIT trades at 77.8% of Net Asset Value (NAV).
- The median REIT trades at 12.6X 2023 funds from operations (FFO).
These are unusually low valuations at a time when the broader market is trading at a rather lofty price to earnings multiple, around 19X (Assuming $220 forward EPS for the S&P).
Pessimism about REITs is so heightened right now that both valuation metrics have been largely dismissed.
The discount to NAV is dismissed by a belief that asset values will drop as cap rates rise, since cap rates are the denominator in asset value. Historically, cap rates have moved in parallel with interest rates but with a lag. So since interest rates just rose by about 500 basis points on the short end and 200 basis points on the long end, many believe cap rates will rise significantly.
The 12.6X FFO multiple is significantly lower than the normal REIT multiple, around 15X-17X. This is a reflection of various bearish views such as the demise of office, impending recession, and interest expense increases. Each of these could reduce FFO, thereby justifying a lower than normal multiple.
The problem with these views is that they are not backed up by the data. As we already showed, property values have risen consistently throughout the rising interest rate period. They have also risen through previous interest rate cycles.
Analyst estimates show FFO rising going forward.
- 2023 P/FFO = 12.6X
- 2024 P/FFO = 12.1X
- 2025 P/FFO = 11.6X
In each of the three, the price is today’s price. The reason the multiple is dropping is because FFO is expected to be higher in 2024 and higher still in 2025. These are not my numbers, these are the consensus of sell side analysts across Wall Street as reported by S&P Global Market Intelligence.
I think the core misunderstanding is that the public markets look at REITs as financial assets. Thus, REITs trade down as interest rates have risen just as a 30-year treasury would trade down in price (up in yield).
REITs are physical assets, not financial assets
While the public markets tend to only look at earnings multiples and NAV for valuation, the private real estate buyer uses a third metric: replacement cost.
The theory of replacement cost as a baseline value
A standing building should be worth at least as much as the cost to build a property of equivalent quality so long as two conditions are met:
- There is demand for the property
- More properties of that type will need to be built at some point
Thus, it may be reasonable for something like office to trade below replacement cost because there is insufficient demand for the category, and it is unclear that we as a country will need to build any more office for quite some time. As such, the cost to construct a new office tower is largely irrelevant to the value of an existing office.
Most sectors, however, do meet the above criteria. For example, roughly 2% of existing inventory of apartments needs to be built each year just to keep pace with household formation. The price of standing apartments that are cash flowing today should stay above the cost of building an equivalent property, as there would be no incentive to build an apartment at a cost of greater than X if one can just buy a property for X.
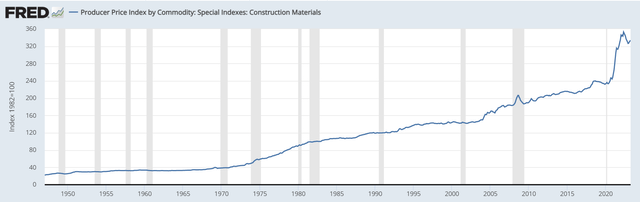
Replacement cost is a metric that is a bit harder to find data on because it is so location specific and property type specific. Thus, my data is mostly at a national level and related to replacement cost of properties in general as opposed to something specific like a 100-unit garden-style apartment in an Atlanta suburb.
Graph #3 materials cost of construction
FRED
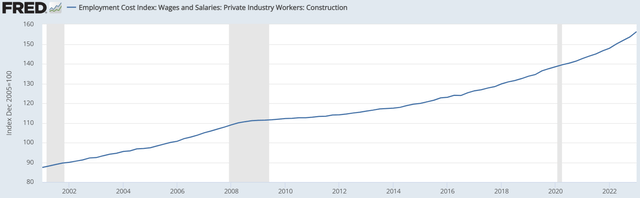
This has been an unusually inflationary time period resulting in the materials cost of construction soaring. A similar although less extreme surge has been documented in the labor cost of construction.
Graph #4 Labor costs of construction rising
FRED
Land prices have risen as well, but these increases are even more local in nature. Timberland in Georgia can still go for $500 per acre while prime Miami land can be well over $1 million for a fraction of an acre. Thus, a national graph would perhaps be misleading to the local realities of construction costs.
Given these figures, I find it very odd that the public market thinks real estate prices are going to drop substantially. Perhaps an upward cap rate adjustment could take prices down a little bit, but given the rather extreme magnitude with which construction costs have risen, I find it more likely real estate values will continue to rise.
The logic is simple: Real estate is needed and the cost to create replacement real estate is higher. Therefore, the value of standing real estate is higher.
Graph #5: Improvement across a variety of metrics
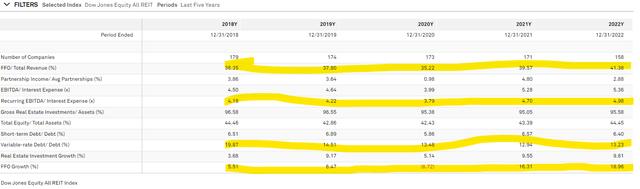
S&P Global Market Intelligence
- FFO margins increased from 38.35% in 2018 to 41.38% in 2022.
- EBIDTA coverage of interest expense improved from 4.18X in 2018 to 4.98X in 2022. Yes, even though interest rates are up, REITs have better debt coverage now than they did when interest rates were 0.
- Variable rate debt has declined to 13.23% of total debt from 19.87% in 2018. Short term debt also decreased, but it was already a very small percentage. Most REIT debt today is fixed rate and termed out.
- FFO has grown significantly in each year with exception to a pandemic dip in 2020. Inclusive of the pandemic dip, FFO is up materially.
REITs improved while prices stagnated
So far we have shown that real estate values increased substantially while REIT market prices stagnated. Cashflows have also improved along with company quality across multiple metrics.
Valuation is both an art and a science. It uses hard numbers which lends itself to mathematical calculations, but the inputs for those numbers often involve assumptions about the future which are of course unknown. A good analyst might be able to make more educated guesses about the future, but it is far from precise. As such, I prefer to look at valuation from multiple angles. The more valuation methods by which a stock appears cheap, the more likely that it actually is cheap.
Given that REITs are attractively valued on NAV, FFO multiples and replacement cost analysis I find it highly likely that the asset class will outperform going forward.
Credit: Source link


