
PM Images
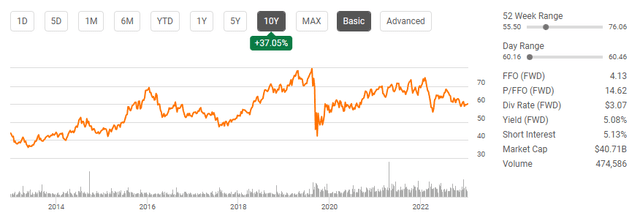
Can you guess what many of America’s most recognized companies, including Walmart (WMT), Kroger (KR), CVS Health Corporation (CVS), and FedEx (FDX), have in common? They lease commercial real estate properties from Realty Income (NYSE:O). Commercial real estate is expensive to buy, and investing in real estate investment trusts (REIT) is a hands-off approach that provides exposure to the sector at a fraction of the cost. I have no interest in being a landlord, and REITs allow me to deploy capital into segments of the real estate market where I want exposure and collect the dividends while others do the work. O has a massive portfolio with over 12,400 commercial properties that are leased to over 1,250 clients. By investing in O, I am gaining exposure to a large portfolio of commercial real estate that services more than 84 industries throughout the United States, Puerto Rico, the United Kingdom, Spain, and Italy. O recently dipped below $60 and is hovering between the $60-$61 level, making the dividend yield cross the 5% mark. I feel that around the $60 level, O represents an opportunity for income investors, especially with inflation cooling to 3% and the Fed Dot Plot indicating cuts are on the horizon for 2024.
Seeking Alpha
Inflation is cooling, and I believe this is positive for income-producing assets.
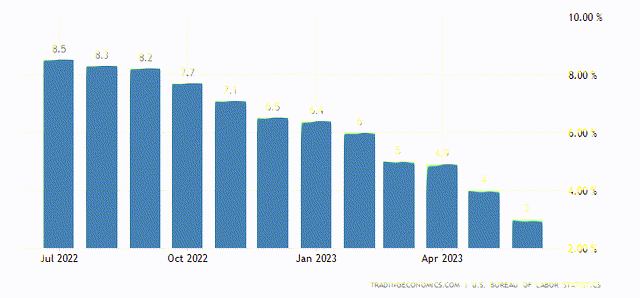
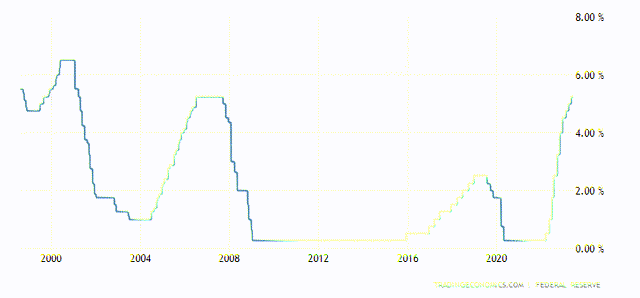
On 7/12/23, the June CPI numbers were released, and inflation came in at 3%, under the expectation of 3.1%. Over the past year, inflation has fallen -64.71% from 8.5% to 3%. The Fed has been laser-focused on reducing inflation at all costs and has increased rates at an accelerated rate compared to any other period in the last 25 years. When the Fed increases rates, income investors have options to generate passive income. Since 2010, we lived in a low-rate environment where the yield from bonds and CDs was unattractive compared to equities. Now with interest rates over 5%, you can get up to a guaranteed 5.35% on a 1-year APY CD, and many CDs will lock you in at around 4.5% for a 5-year APY. Being able to earn 5% on your money risk-free is a real option compared to equities for income-focused investors, and when rates are around 4-5%, cash tends to stay on the sidelines. While I am invested in many equities, I am rolling cash in a 3-month CD because of the yield, and I know quite a few people doing the same thing. When rates are high, non-risk assets become attractive, and money flows into them, because why take on risk to generate yield if you don’t have to?
Trading Economics
Trading Economics
Increasing interest rates is the main tool the Fed has at its disposal to battle inflation. The next FOMC meeting will be held in less than 2-weeks, and we will get new commentary on the Fed’s outlook and their decision on rates. The CME FedWatch Tool indicates a 94.9% chance we see a 25 basis point increase later this month. We know that the Fed’s previous thoughts were that we would see an additional 2 rate hikes before the end of 2023. While I can’t predict the future, and my opinion differs from the Fed’s, I must make assumptions based on the information I have. The St. Louis Fed indicates that rates will decline to 4.6% in 2024 and 3.4% in 2025. Regardless of the outcome of the next FOMC meeting, the longer-term outlook is that rates will decline in 2024 and into 2025.
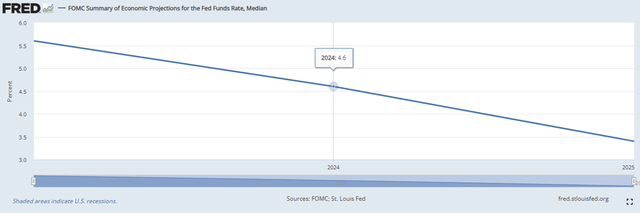
ST. Louis Fed
As rates decline, I believe it will lead to business expansion as more companies will be willing to borrow as the cost of capital declines. If this occurs, more money will be spent throughout the economy and should increase the earnings power for publicly traded companies. While decreased rates should create increased economic activity, it should also make income-producing assets more appealing. Eventually, the days of high yields from risk-free assets will be over for people who didn’t lock in long-term CDs or bonds. For investors looking for yield, the focus should shift back to the market as parking capital on the sidelines won’t be as productive in the coming years based on the St Louis Feds rate trajectory. As rates decline toward 3% and under, I think taking on equity risk to generate 4-6% yields will become more acceptable to conservative investors, and we will see money from the sidelines earmarked for producing income flow into income-producing assets. Ultimately I believe this will be positive for companies like O that have established strong dividend track records.
If I was constructing a new Dividend Portfolio, Realty Income would be at the top of my list
Opinions vary, and what is important to one income investor may not be important to another. Some chase yield, while others focus on dividend growth. I am a shareholder of O, and while I am a shareholder of many companies, if I was going to reconstruct or create a new income-focused portfolio, O would be one of the first companies I add. O has established a dividend track record that is hard to match, and its accomplishments are difficult to overlook.
First, if I had to choose a dividend payment schedule, I would prefer receiving my dividends monthly rather than quarterly. I am cheap, and this allows me to increase the impact of compound interest. O is also known as The Monthly Dividend Company and is one of the only members of the revered Dividend Aristocrat club that pays monthly dividends. O is also one of the only S&P 500 members that has a yield that exceeds 4.5%.
From a dividend perspective, not many companies can rival O. Over the past 54 years, O has produced 637 consecutive monthly dividends. Since 1994, O has provided shareholders with 121 dividend increases and has strung together 103 consecutive quarterly increases. Since the 1994 NYSE listing, as of data from 6/13/23, O’s dividend has had a compound annual growth rate (CAGR) of 4.4%. Today, O has a dividend yield of 5.13%, and when you combine the yield with O’s dividend history, not many companies can rival the income that continues to be generated. Since going public, O has paid over $11 billion in dividends, and generated continuous value for shareholders.
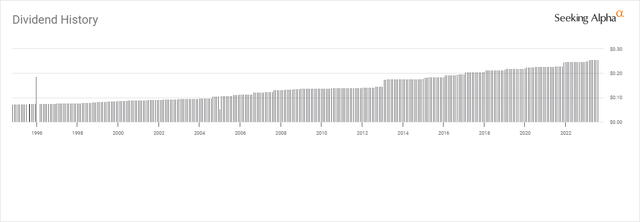
Seeking Alpha
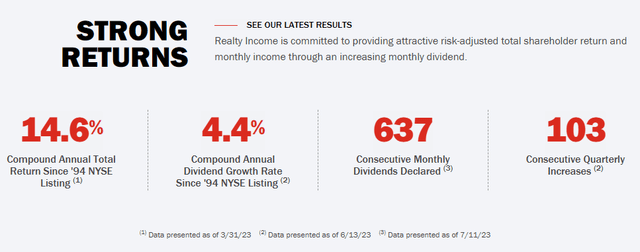
Realty Income
If you’re able to make an income investment earlier on in life and allow the powers of compounding to occur, the effects can be extremely impressive. Going back to January of 1995, if you had invested $10,000 in O, you would have acquired 1,222.49 shares. At the time, O had generated a monthly dividend of $0.07, which is $0.87 on an annual basis. The initial investment in O would have produced $1,065.03 in forward income. Over the years, O has increased its dividend by 251.24% as the monthly dividend has grown from $0.07 to $0.26, and the annualized dividend has increased from $0.87 to $3.06. Without reinvesting the dividends, each share would have produced $49.31 of income, which is a total of $60,280.98 over the years, and is still producing $3,740.82 on an annual basis. If you had reinvested all the dividends along the way, the initial share count would have increased by 463.27% to 6,885.89 shares. The combination of increased shares and dividends places the forward dividend income at $21,070.82, an increase of $20,005.79 or 1,878.42%. The investment value has also grown by 4,052.88% as the investment of $10,000 has grown to $415,390.01.
Past performance is not indicative of what will occur in the future, but it can provide a roadmap of what could occur. I have no idea what O’s share price will do, but from an income perspective, there is no reason why the dividend can’t continue to grow at the current trajectory. In my opinion, O is a top-tier income-producing investment, and I would place it high on my list of income investments to add to or build an income portfolio around.
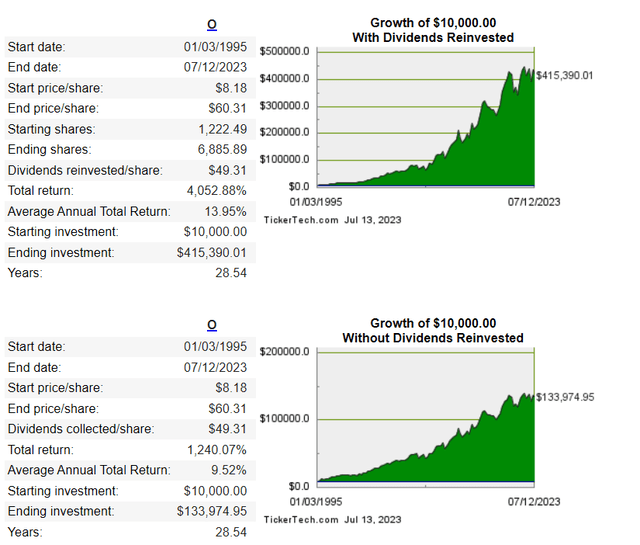
Dividend Channel
While Realty Income has been a strong investment, I always look at how it’s being value compared to its peers
I compared O to its peers and looked at their FFO, EBITDA, debt, dividend, and book value to see how it’s being valued. My preference is to be an indirect landlord outside of my personal real estate, and REITs are my preferred way to invest in real estate. For O’s peer group, I used:
- Kimco Realty (KIM)
- Federal Realty Trust (FRT)
- National Retail Properties (NNN)
- Regency Centers Corp. (REG)
- Brixmor Property Group (BRX)

Steven Fiorillo, Seeking Alpha
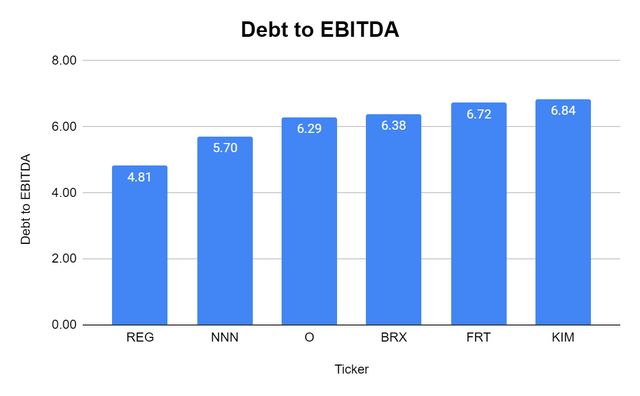
O generates the largest level of EBITDA as it has produced $3.09 billion in the TTM, while the next closest peer was FRT generating $1.06 billion. The average debt-to-EBITDA ratio for the peer group is 6.12x, and O is right in the middle of the pack with a 6.29x debt-to-EBITDA ratio. Looking at the group, O’s debt-to-EBITDA ratio is in a range that I am ok with from an investment perspective.
Steven Fiorillo, Seeking Alpha
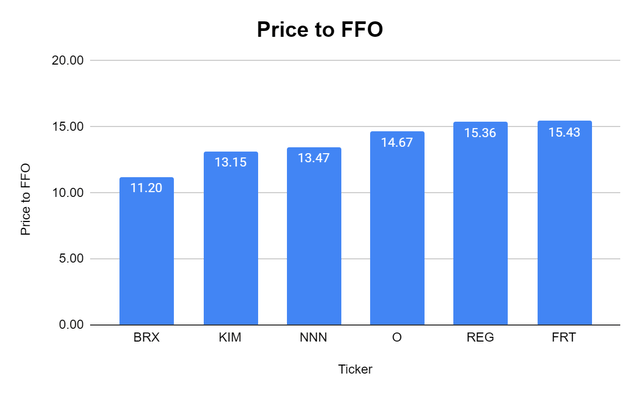
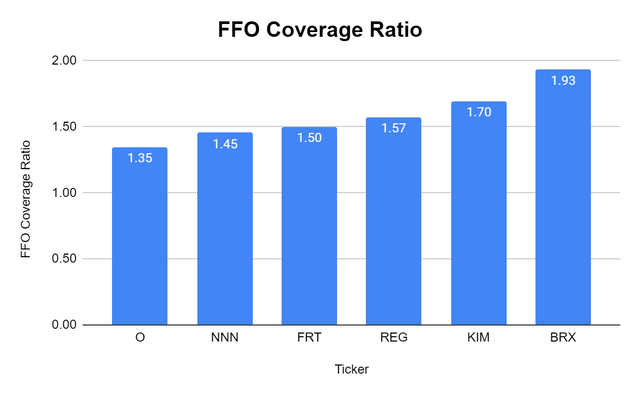
I like to pay a low price for a REITs FFO. O has a price to FFO of 14.67x compared to the peer group average of 13.88x. O also has an FFO coverage ratio of its dividend of 1.35x compared to a peer group average of 1.58x. While O trades at a slightly higher price to FFO and has a lower coverage ratio on its dividend than its peers, O is still generating 35% more FFO than it’s paying out to the dividend.
Steven Fiorillo, Seeking Alpha
Steven Fiorillo, Seeking Alpha
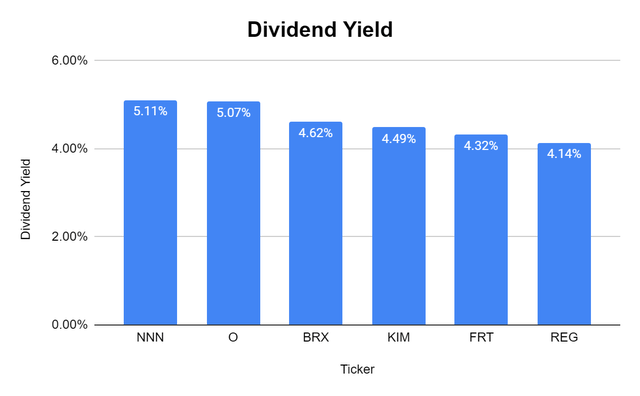
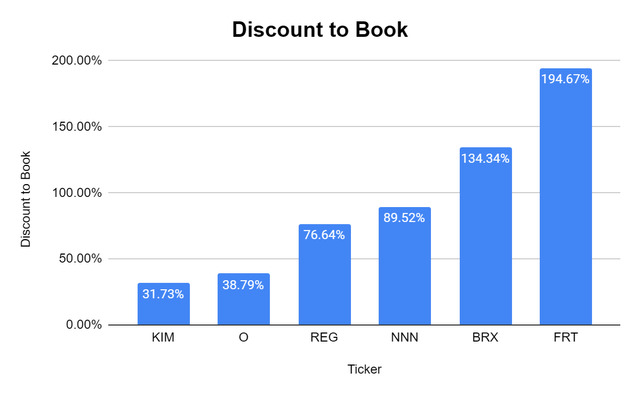
O has the largest dividend yield of the peer group at 5.11% compared to a 4.62% peer group average. O also trades at a 38.79% premium to book value compared to a peer group average of 94.4%.
Steven Fiorillo, Seeking Alpha
Steven Fiorillo, Seeking Alpha
Overall, O may not trade at the lowest valuation in every metric, but from an overall perspective, I like O at these levels. O is valued on the lower end of the spectrum, looking at the discount to book value, while generating the most EBITDA and dividend yield. O doesn’t have outsized debt, and the multiple you would pay on its FFO is fair.
Conclusion
I think O is a strong income investment to consider at these levels. If I was going to reconstruct or create a new income-producing portfolio, O would be a top-tier candidate. As interest rates decline next year, I think people will be scouring the market for yield, and we will see an inflow of capital come into the market and push companies such as O higher. By investing in O, you become a landlord to America’s largest companies and get paid over 5% to sit back and do nothing. I think O has the ability to continue its dividend growth trajectory, and at these levels, O is a buy.
Credit: Source link