

Nuthawut Somsuk
There is no denying that Realty Income Corporation (NYSE:O) has delivered the quality long term income stream that investors have craved. To top off the steady monthly dividends, they actually keep raising it, again and again and again. The dividend signaling theory would argue for this to trade at a premium multiple and win investors of all stripes. After all, who else has done something like this?
While not exactly the same track record, NNN REIT Inc. (NNN) has certainly delivered the goods for income investors as well. We examine the two and tell you how the most obvious trade of the past few years actually worked, but not in the way you would have predicted. We then tell you why it is time to go in the opposite direction.
The Record
Realty Income has delivered an outstanding 29 years of rising dividends.
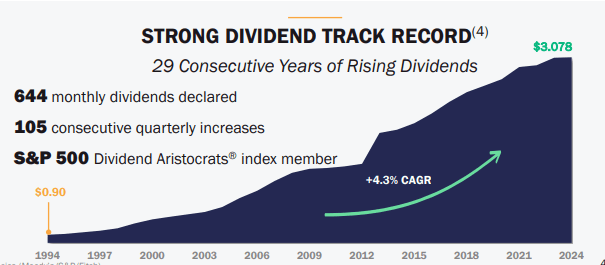
Realty Income Presentation
Most investors might not know this, but NNN has actually done better.
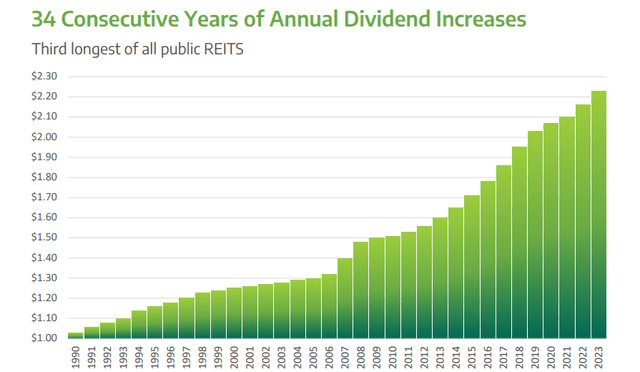
NNN Presentation
Of course barring NNN actually stopping this growth, there is no way for Realty Income to get ahead. But for practical purposes this is not relevant as we are looking at two exceptional companies and 29 versus 34 hardly matters.
The Long Standing Argument
While their records have been similar, the general consensus had been that NNN is the better play compared to Realty Income. That was not based on the extra five years. It was based on two major factors. The first being that NNN was the smaller REIT and it was not even close. Note the chart below goes to March 2023. We have left out the entire Spirit Capital acquisition saga.
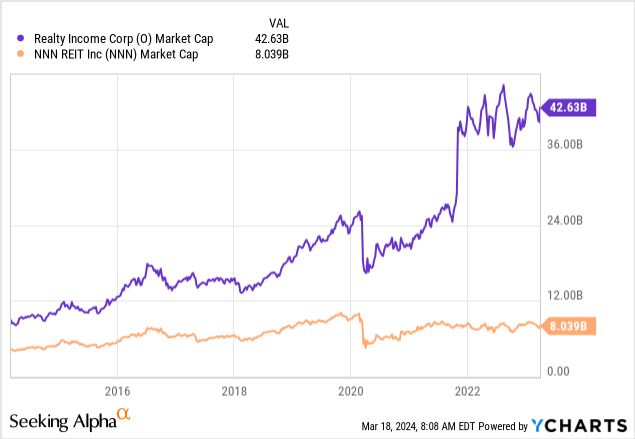
Realty Income’s larger size was supposed to be a hinderance to growth. That made sense as it is harder for Realty Income to move the needle on the larger enterprise value with acquisitions. The other factor was that NNN was always trading cheaper compared to Realty Income on a price to funds from operations (FFO) ratio. So you were theoretically getting a cheaper company with higher growth potential. This argument made rounds regularly on Seeking Alpha, especially after Realty Income swallowed up VEREIT and gained a little more on the hips.
How That Played Out
If you made that call that NNN would do better than Realty Income, you turned out to be basically correct. 11.25% over three years is a lot of extra alpha and those that made that call deserve credit.
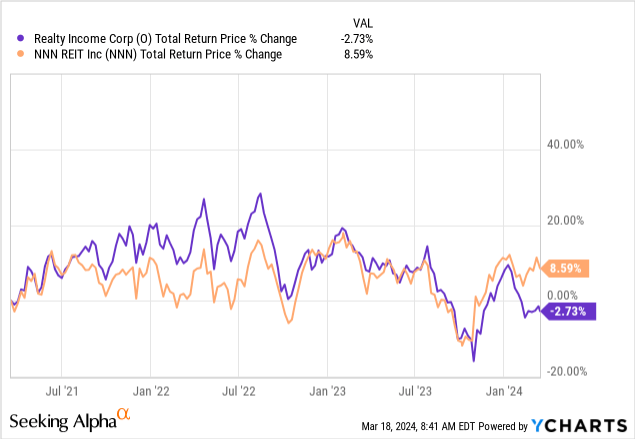
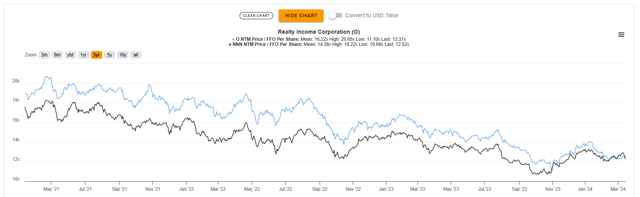
Now the interesting part is that it did not happen because of the slower growth from Realty Income. In fact both have grown at almost exactly the same rate. You may get some differences based on your exact start point but even those tend to show Realty Income edging ahead in growth. So what really happened? You got both multiples falling and Realty Income’s fell more, a lot more.
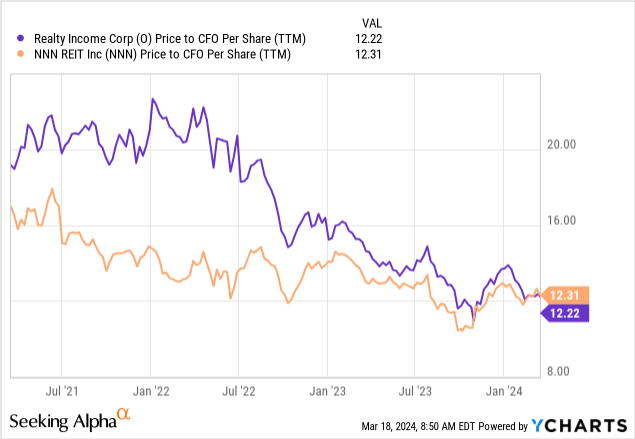
Y-Charts above shows price to cash flow per share. We use this as it is the best one we can get that represents the price to FFO multiple. But here is the price to FFO per share for the hardcore REIT minds. We see a very similar trend.
TIKR
Investors might wonder if this is coming from some noise via the Spirit Realty acquisition. While the multiple compression could certainly be attributed to that, the numbers themselves are clear. Even on a forward FFO basis, Realty Income is cheaper than NNN REIT for 2024 and 2025.

Seeking Alpha-O Estimates
NNN is also expected to grow slower, despite the more nimble setup.

Seeking Alpha-NNN Estimates
Verdict
Both Realty Income and NNN REIT have solid balance sheets. Realty Income has A- rated credit and 5.5X debt to EBITDA ratio.
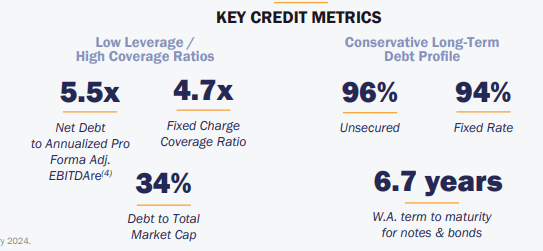
Realty Income Presentation
NNN REIT is one notch lower at BBB+ and carries the same debt to EBITDA ratio.
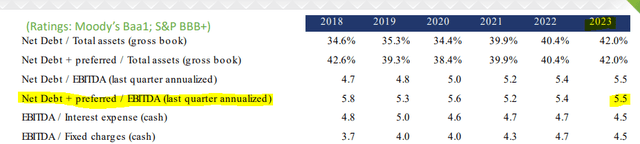
NNN Presentation
But that (one notch higher) does give Realty Income an edge should financial conditions deteriorate.
NNN’s smaller size has also not really boosted growth on a relative basis, despite multiple assertions for the opposite. In fact, Realty Income has been able to use its size to make large acquisitions and move the gauge on its FFO per share.
Finally, you are no longer being penalized for choosing the monthly payer versus the quarterly payer. We have often pointed out that investors have sacrificed higher income simply because they have not been able to plan around a significantly higher quarterly payout. But when you are comparing these two, you are actually getting more from Realty Income!
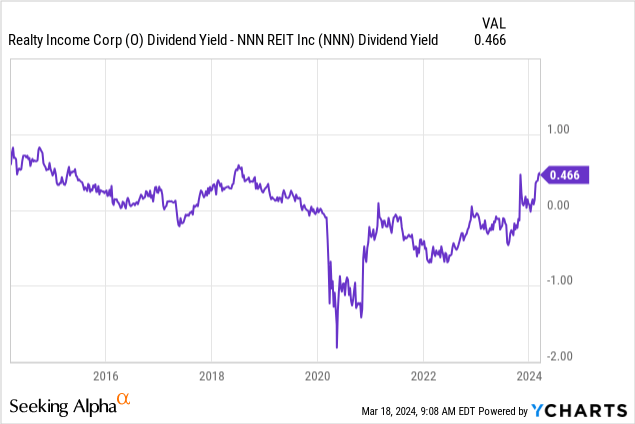
This premium is now at 0.466% and quite high relative to its decade long range. While we recently put the buy rating behind Broadstone Net REIT (BNL), out of these two, there is no question that Realty Income has now become a better play.
Realty Income Corporation 6% PFD SER A (NYSE:O.PR)
Those that just want their dividends and want an even higher level of safety, may want to consider Realty Income’s preferred shares. These were inherited from the acquisition of Spirit Capital and have a current stripped yield of 6.2%. We don’t see the appeal in these as you are essentially getting very little extra relative to the common shares and giving up a lot of potential long term upside. This, to us is very similar to the case between Agree Realty Corporation (ADC) common shares and ADC preferred shares (ADC.PR.A). But those that consider macro risks to real estate as being significantly more today, may want to buy those instead of Realty Income common shares.
Please note that this is not financial advice. It may seem like it, sound like it, but surprisingly, it is not. Investors are expected to do their own due diligence and consult a professional who knows their objectives and constraints.
Credit: Source link