

Richard Drury
Introduction
When looking for stocks that provide passive income for your retirement, you are looking for some safer investments that help you sleep at night. Realty Income (NYSE:O) is a stock that has been adored by many dividend investors. As such, Realty Income might be considered as a boring stock, but that’s exactly what you want in your retirement portfolio. A stock that pays you every month while having some capital appreciation along the way.
Currently, the stock gives a 5% dividend yield, and we believe O is an interesting buy whenever the company has a yield above 5% (of course without the fundamentals significantly changing).
Today we will take a look at this beautiful Dividend Aristocrat, which reports earnings tomorrow after market close.
Dividend Compounder Which Pays Monthly
Realty Income is one of the oldest publicly-traded REITs available on the market. The company pays a dividend each month, which makes it an excellent income generating stock.
Below you can see the dividend and its yearly increase over the last 10 years. As can be seen, the dividend has steadily increased over the last 10 years, and according to Seeking Alpha the expected total dividend from Realty Income for 2023 is expected to be between $3.02 and $3.11. As such, we took $3.06 as a median.
Stock Info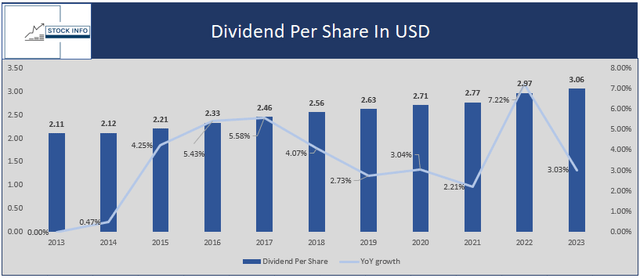
As can be seen in the chart above, the company has increased its dividend at a steady pace. This results in a 5y dividend CAGR of 1.50% and a 10Y dividend CAGR of 3.48%.
Let’s take a look at some of the dividend projections through 2025. We will be doing this by taking a look at a bear case, a base case, and a bull case. All these numbers are projected with the starting yearly dividend of $2.97, which equals the total dividend received in 2022.
In the chart below, you can find the expectations for each 5-year period starting from 2025.
Bear Case: For the bear case we used a 2.5% dividend increase this is well below the 4% 2025 growth consensus. In addition, this is below the long-term inflation expectation from the bond market, as the 10 Year Treasury Rate is currently at 3.96%. Currently this would give a 5.33% yield on cost in 2025 and almost a 10% yield on cost in 2050.
Base Case: For the base case we decided to use a 3.6% dividend increase. While this is still below the 4% consensus, we want to be sure we are on the safer side with these estimates, as it obviously is based on guesses and thus warrants a margin of safety. This would give a 5.50% yield on cost in 2025 and a close to 13.33% yield on cost in 2050.
Bull Case: For the bull case we picked a 4.5% dividend increase, which is slightly above the consensus rate and around 1% above the 10Y dividend CAGR. This would give a 5.65% yield on cost in 2025 and a close to 17% yield on cost in 2050.
Stock Info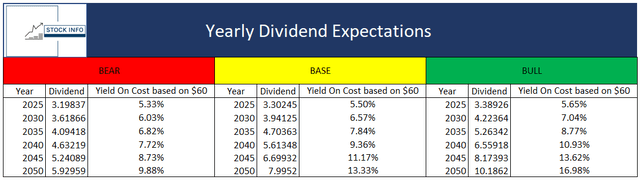
This doesn’t sound too bad for the long-term income-seeking investor I would say. This isn’t even taking into account the potential of capital appreciation and dividend reinvestments. For reference, the stock has appreciated close to 670% since going public in late 1994.
This means the stock has risen around 7.29% per year on average. Pretty solid right? While the stock isn’t likely to grow at the same rate over the next 30 years due to the company maturing, you can still expect pretty solid returns.
In addition to collecting your dividends each month, we will discuss how you can get paid even more for holding your shares of Realty income in the next part of this article.
Compounding On Steroids
While I’m not typically a dividend investor myself due to unfavorable tax policies regarding dividends in my home country, I’m a big fan of generating capital while holding shares. Yes, most of you probably have heard of this before; in this part we will be discussing covered calls, but this isn’t the only thing we will be discussing here to generate extra income. In addition to the covered call, we will be discussing the cash-secured put as well. Held together, these two strategies are called a short strangle.
In general, a short strangle is a strategy that is used if one wants to capitalize from a stock trading in a specific range over a specific period of time. In this case, we will be using this strategy so that you, the income-seeking investor, generate even more income while holding your shares.
Let’s say you don’t mind buying 100 shares of O at $60 per share on January 19th of ’24. At the moment of writing, this cash-secured put gives you $2.09 or $209 in total as each option contract in the US market has an underlying of 100 shares. This represents a 7.04% return on a yearly basis at the moment of writing.
In addition to the cash secured put we also write a covered call. Let’s say we don’t mind letting go of 100 Realty Income shares at $65 per share. If we take the same expiration date (January 19th 2024) this would give us around $1.25 or $125, representing a 4.12% return on a yearly basis.
In total, this would mean we would have collected an additional $324 on top of the dividends we collected along the way. Keep in mind this is based on a 100-share example. If you want to use this strategy with 1000 shares, you would just sell 10 contracts of each resulting in a premium collected of $3240. Given you can do this options strategy a little over twice a year, this would generate an additional $6.86 in income per share each year. In total to the expected $3.06 dividend for this year, this would give a total of $9.92 per share or a yield of 16.14%.
Obviously, you can tweak this strategy as you see fit. For example, if you feel like the share price of O is getting a bit high, you can decide to sell more covered calls. If you feel like Realty Income shares are getting too cheap you can decide to sell more cash secured puts.
Furthermore, you don’t have to hold these contracts till expiration, you can take one side of as you see fit. It is important that you manage this to make sure you roll the contracts in time if you don’t feel like letting go of 100 shares or if you don’t want to buy an additional 100 shares due to a change in the fundamentals. In addition, I wouldn’t advise doing this on your full position, especially not the put side due to the risk of a black swan event, for example, the covid-19 crash.
Below you can see a graph of the P&L curve of this option strategy at the date of opening the position. The solid white lines show the P&L of this strategy at expiration date (January 19th 2024). You can see that the breakeven bounds of this trade would be around $56.67 and $68.24 respectively, if held until expiration.
Stock Info with IBKR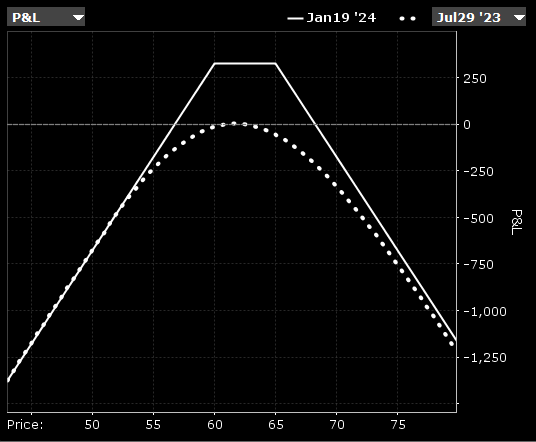
You can also take this strategy off way earlier if you don’t feel like holding till expiration or for other reasons. For example, you could set a take profit at around 25 or 50% and then just repeat the strategy with adjusted strikes at a further expiration date.
Great Execution + Straightforward Business
Realty Income, alongside with the rest of the REITs has been underperforming in 2023 and for good reasons.
While O has robust fundamentals the elevated interest rates alongside macroeconomic headwinds have been dreadful for the REITs. The company is currently down over 10% since the end of January and in the short-term the stock price could definitely deteriorate further.
Nonetheless, Realty income continues to execute. The company has a growing portfolio in both Europe and the United States, currently counting over 12,400 commercial properties with a 99% occupancy rate, which is remarkably strong in times of macroeconomic hardship.
Realty Income
In addition, Realty income is well diversified and focuses on long-term leases, with the average lease term being close to 10%. The clients of O are in all different types of industries, companies such as Dollar General (DG), CVS Pharmacy (CVS), Walmart (WMT), and Walgreens (WBA), just to name a few. We will discuss the closure of some Walgreens stores later on.
The slide below from their earnings presentation shows their top 20 clients, in which you will definitely recognize some brands.
Realty Income Q1 Presentation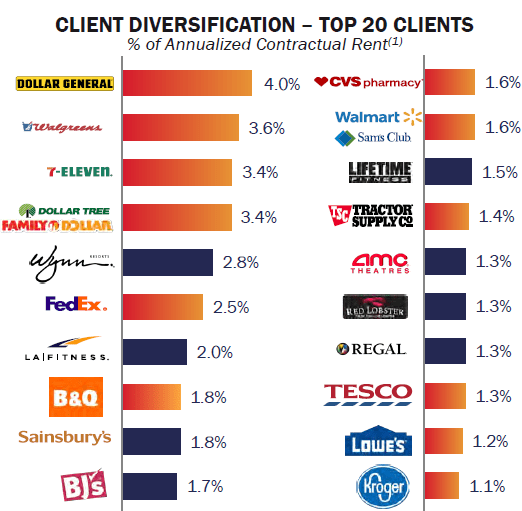
Realty Income has shown that they are able to continue growing. The company has grown its revenues from $1.02B in 2015 to $3.47B over a trailing-twelve-month period. The chart below shows this revenue growth on a year-on-year basis. This gives a 3 and 5Y revenue CAGR of 30.82% and 22.95% respectively.
Stock Info with Seeking Alpha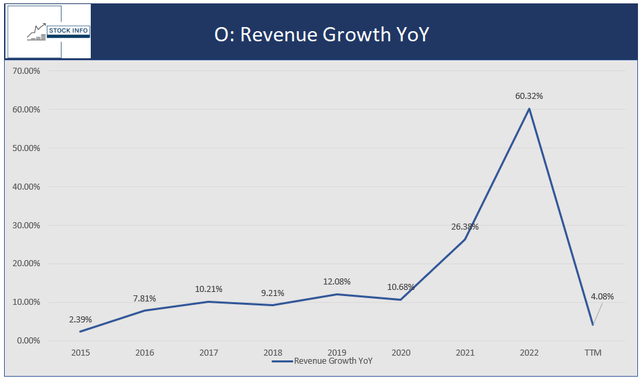
O focuses on freestanding single-unit commercial properties which they lease to high-quality clients under long-term, net lease agreements, typically in excess of 10 years, according to the company.
These triple net leases are meant to preserve consistent cash flows. In addition, O is committed to maintaining their high investment-grade ratings. The A3 and A ratings from Moody’s and S&P give O a competitive advantage over their competitors, as they have easier access to attractively priced debt.
O has a $4.25B multicurrency revolving line of credit, which allows them to act quickly on upcoming opportunities. These can be acquisitions or to raise equity when they believe the conditions are favorable. For example, O recently issued 2 senior notes which have a combined average tenor of 9 years at an average yield to maturity of 5.08%, worth $1.2B in total. In addition, O has recently bought $2.6B in real estate with an average capitalization rate of 6.8%.
Risks and Walgreens
While the macro headwinds and elevated rates might remain an issue for a while longer, we believe O has shown is ability to execute during these rough circumstances and we believe that it will continue to do so in the future.
In addition, many people have been worried about the effect of Walgreens decision to close 150 of its U.S. stores. But, this isn’t an issue for O. As a matter of fact, WBA must continue to pay the lease until the lease expires or until a new tenant moves in. This is beneficial to O as they might be able to negotiate a better deal with the new tenants.
Furthermore, if the economy takes a turn for the worst O is still positioned well due to these long-term agreements that must be fulfilled. One has to remember that even during the Great Financial Crisis Realty Income had an occupancy rate of 96%. As such, we believe this WBA news is short-term noise and won’t have a big impact on O’s earnings.
Technical Analysis
Yes, I know what you might be thinking, “I don’t care about TA, because I plan on holding this stock for years”. That’s definitely a valid point and for the long-term holders fundamentals are more important. Nonetheless, even you can benefit from some quick technical analysis. TA gives you the possibility to identify key levels, which can help you with deciding when to add some more shares or when you want to sell some shares.
In addition, technical analysis can also be very helpful for the option strategy, which helps generate extra income. TA can be a very useful tool to help you decide when you might want to sell some puts or calls.
Let’s take a quick look at the chart. As you can see, O is moving between the 2 purple trend lines. This pattern is what we call a symmetrical triangle, the purple support line has proven to be a solid support and it is likely this level will provide an interesting buying opportunity if the stock is able to hold. This line is currently between $59-$60, which is where the stock is likely to find support.
On the other hand, we got the purple resistance line, which last week coincided with a strong horizontal resistance level (red line). As you can see, this was a strong resistance level and Realty Income stock was unable to break above this level.
Stock Info with Tradingview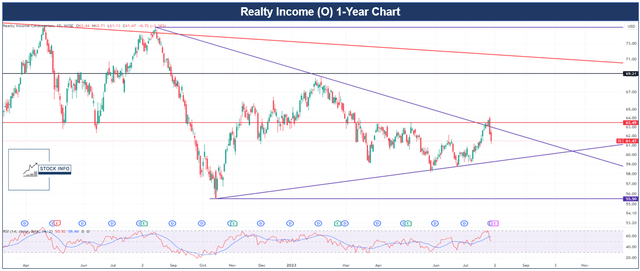
Conclusion
In conclusion, Realty Income stands out as a perfect income investment for retirement. With its stable and steadily increasing monthly dividends, it provides a reliable source of passive income for investors. Additionally, the company’s focus on long-term leases and diversified portfolio ensures consistent cash flow even in challenging market conditions.
We believe the short strangle strategy provides an enticing way to generate additional income through covered calls and cash-secured puts, further enhancing the overall yield. Realty Income’s strong execution and commitment to maintaining high investment-grade ratings bolster its position as a solid income generator.
Despite short-term concerns surrounding Walgreens store closures, Realty Income’s long-term lease agreements provide protection and resilience. Technical analysis indicates potential buying opportunities around the $59-$60 support level, making it an appealing prospect for investors seeking income and capital appreciation.
In summary, Realty Income emerges as an attractive choice for retirement portfolios, offering stability, income, and potential growth prospects, making it an excellent income investment for the long term. As such, we currently rate O as a buy.
Credit: Source link