
Douglas Rissing
With the possibility of a recession during a period of high inflation, something we haven’t seen in decades, I thought it would be a great time to do a write-up on the treasury and rate markets, as I find most of the analyses by both sell-side researchers and that of Seeking Alpha analysts to disagree with my own views.
Macro Backdrop
There are many things that make rates move from demographics to debt levels, FX demand for current base currencies etc.; but in this environment, it is clear that the two main push and pull on rates is growth and inflation. We are in a system where both public and private institutions are heavily dependent on debt for growth and spending, but at the same time inflation is high, so the Fed has to balance both; the long end of the curve will likely follow what it believes long-term inflation expectations to be along with economic growth expectations.
What I believe most of the market has mispriced is how high rates will go and for how long. My belief is that inflation is far sticker than most market participants think and that it will force the Fed to hike far more making for higher yields and lower treasury prices. Ultimately I think this comes down to most market participants misunderstanding what is causing this now structural inflation and hence not pricing in the right expectations. Ultimately, if one can get the inflation call right for the next year then they can get the call on rates right: higher inflation = higher rates and vice versa.
Inflation: 1940s Versus 1970s
Most investors don’t believe in the secular inflation story, but of those who do they tend to look back to the 1970s as it was the most recent period of time where the United States had high inflation. The issue with using the 1970s as a blueprint for how the 2020s play out is the two periods have fundamentally different root causes for inflation, which leads investors to misunderstand what will happen as an effect in markets.
This is also where the 1940s come in. The 1940s were a far better representation of today’s environment and so I believe a comparison between the 1940s and 1970s is needed to understand today’s inflation environment.
Below is the debt to GDP for the United States:
US Debt To GDP (Trading Economics)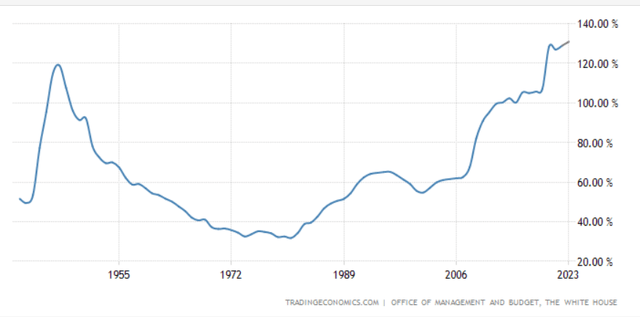
The first major difference between the 1940s and 1970s is the starting point. Due to the large deficit created by WW2 the debt to GDP was very high, whereas the debt to GDP was historically low in the 70s.
The reason to have high inflation in the 1940s was to wipe out the high debt by inflating it way. This is very analogous to today’s environment where the recent pandemic can be thought of as a war similar to WW2 in the 1940s and the inflation afterwards is used to inflate the debt away. Another major similarity between these two periods is the cause of inflation. Inflation in these two periods was caused by large amounts of fiscal spending done in a helicopter manner, meaning that the average Joe and Jane had a large cash pile they previously didn’t have and spent that into the economy causing prices to rise and a shortage of supply.
This is very different from the 1970s when the debt was very low in comparison and grew in the 1980s while inflation actually went down. The main cause of inflation in the 1970s was bank lending causing a money multiplier effect. This was possible as the private sector had little debt making for a strong balance sheet, and the economy of the 1960s was strong making for strong private sector P&L. This is completely different from the 1940s and the current environment. Prior to the 1940s, the economy had done terribly due to the Great Depression and WW2; similarly, the 2010s were a lousy environment for the average man on the street even though asset prices went up. Asset prices going up during the 2010s gives the illusion that the economy was doing great, but in reality, it was a two-speed economy where those who were wealthy and owned assets did well, but those who didn’t own assets such as their own home or an equity portfolio did badly as they missed out on the upside of these assets meaning they now have to buy them at unaffordable amounts, and simultaneously real wages for blue-collar workers were stagnant while jobs were being outsourced; hence why we have a major wealth gap between the haves and have-nots. This makes it so that bank lending in both the 1940s and in today’s environment has shrunk.
I highlighted above the major differences. The biggest thing to remember is that inflation today, similar to the 1940s is fiscally driven not monetary driven like the 1970s. The most obvious manner in which to get rid of fiscally driven inflation is to cut spending and raise taxes on the middle class and poor(raising taxes on the wealthy won’t work as they primarily spend their income buying assets unlike the poor and middle class who spend their income buying consumer goods). This is politically unpopular and we haven’t yet seen any signs this will happen. The second option is to tighten credit so much that the money supply shrinks. When a debtor defaults on a loan to a bank due to not having the capital to pay, the money that should’ve been paid goes to money heaven, hence it shrinks the broad money supply. Since Congress has shown no sign of the first option and since the Fed is in charge of only monetary policy they can’t do anything about fiscal directly, hence the second option is what is left. This means that as long as inflation is high and credit is loose, the Fed will be forced to raise rates further until a recession happens.
Inflation Has Been Shown To Be Sticky
Although inflation has come down it has done so in a slow manner and it seems to be slowing; bringing inflation down from 9% to 5% is easy in comparison to bringing inflation from 5% to 2%. I believe the “low-hanging” fruit has been taken and it will be harder from here.
CPI Stats (BLS)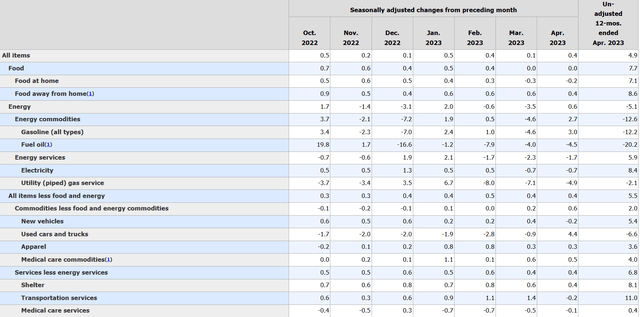
Above is the CPI breakdown from the BLS. Over the last year headline year-over-year inflation has definitely gone down. But over the last couple of months, it has stagnated as the monthly inflation rate is flat. This to me is a clear sign that it will take more rate hikes to reduce inflation by tightening credit. On top of this the “low-hanging fruit” is food and energy. Food prices spiked in 2022 when Russia invaded Ukraine and has since come down, as can be seen in the below chart.
S&P GSCI Agriculture Index (S&P Global)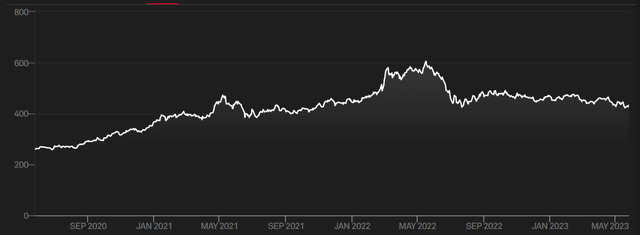
As can be seen in the above chart agricultural commodities have come down and then plateaued sideways. Something similar is happening in energy:
WTI Front Contract on Rolling Basis (TradingView)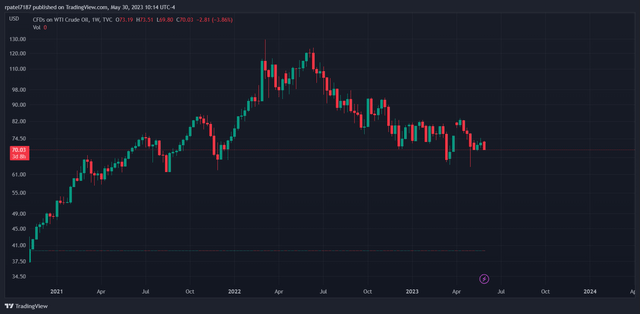
Above is WTI crude oil. As can be seen crude spiked in Q1 of 2022 and has since come down, but is unlikely to come down more. This is because most producers have a breakeven of $45-$55, so prices have a supply floor, and OPEC+ has shown that they will cut production when prices fall.
NATGAS Spot Price (TradingView)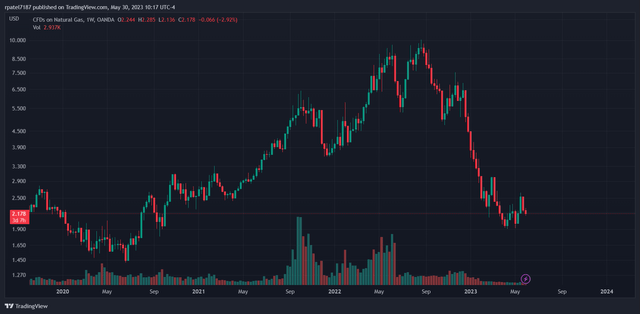
As can be seen above natural gas has also come down significantly. All of these commodities have come down to the point where there is a supply floor, meaning that supply will start to go down putting a floor on the price.
This is why I think that it’s better to look at core inflation rather than headline inflation in this environment where energy and food prices have pulled back but have likely reached a floor. If we look at the monthly core CPI then we see that it has stayed flat. This means that core CPI is “sticky” around 5%. As energy and food prices get a floor and remain stable this will pass on to the headline CPI.
The two main calculations in core CPI that would make a big difference and cause it to go down would be the owner’s equivalent rent and line items that are consumer discretionary. My belief is that both rent and consumer discretionary won’t go down till we have a higher amount of unemployment. Higher unemployment likely won’t happen without significantly higher rates which causes a credit crunch. As I previously mentioned, because this inflation was created by fiscal policy, raising rates won’t directly be able to stop it, so the closest they can get is to crunch credit enough to reduce the money supply and lower velocity.
Market Pricing
While I’m very hawkish on where monetary policy will trend, the market has already priced in cuts. This means that even if rates stay flat bonds will go down.
The best way to see where the market expects rates to go is to look at the Fed Funds Futures. Below is a chart showing what the market is pricing in:
Fed Funds Futures (Yardeni Research, Inc)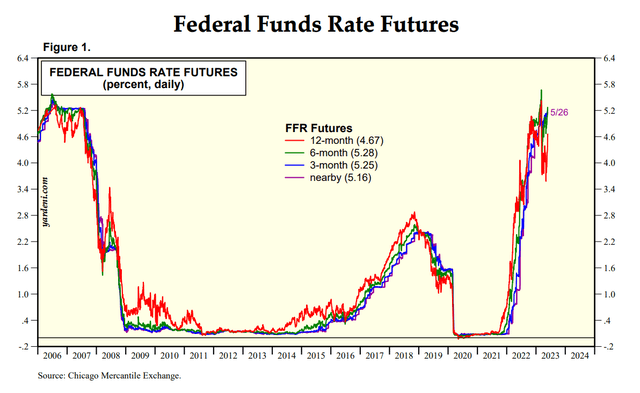
Fed Funds Futures are pricing in rates staying flat for the next 6 months then a 1% rate cut 6 to 12 months from now. I find this to be an extremely dovish scenario, and as I previously mentioned even with rates where they are the main street economy isn’t facing unemployment as high as one would expect so rate hikes are far more likely than what the market is pricing in.
This goes along with a narrative I’ve seen in the rates market for the last two years which is that rates were always going higher than what the market thought, and the main street economy is more resilient than what the market had priced in. In early 2021 we would hear traders repeating what the Fed said: “We’re not thinking about thinking about raising rates”; then when inflation became a serious issue in early 2022 we’d hear traders say something along the lines of “rates can’t go higher than where they were in 2018, as it will crash the stock market like it did in Q4 2018”, which ended up being wrong. Then more recently in early 2023, I heard many talking heads say things along the lines of the following: “With the collapse of SVB the Fed must pivot to avoid a banking crisis”, and then the Fed ended up hiking. My point here is that every step along the way the market has underestimated how persistent inflation would be and how much the Fed would raise to try to fight it. What the market didn’t and I believe still hasn’t understood is that it is inflation>economy/market, meaning that the Fed is willing to sacrifice the economy along with the stock and bond market to stop inflation and keep its reputation intact.
Response Mechanism Reversed
What I believe will add to all of this is a lag in the response mechanism that we saw in the past from the market. What would happen in the past was that the market would go down when it saw a recession on the horizon. This was a signal to both monetary and fiscal authorities to loosen policy. By the time the recession happened, the market would’ve already bottomed. In this case, the market would be a forward-looking indicator. Over time as the economy has become more financialized what we’ve seen is that an equity market sell-off will be the catalyst for a recession. Now though the market actually seems to be more of a lagging indicator. An example is in early 2020 when it was obvious to the man on the street that the coronavirus was serious and vulnerability was already showing in areas such as the oil market which was far too oversupplied. Even with all this information the market didn’t go lower, instead, it continued its upward trend, completely oblivious to what was happening. It wasn’t till there were significant flows out of the market that it declined and did so quickly. It also lagged on the way back up, as it only bottomed when the CARES Act was passed, rather than moving up prior to its passing as should be a forward-looking indicator that is able to predict the coming stimulus.
Mike Green, whom most readers likely know about, has a theory about passive flows and how they are reversing the manner in which the market acts. For those who aren’t familiar with his work on passive, I will summarize it and how it relates to markets lagging behind the economy. Normally markets are mean reverting in that when valuations are too cheap market participants will buy and when it is too pricy they will sell. This keeps valuations in line and as new news hits the tape investors will take that into account and the market will adjust. This is what makes the market forward-looking and mean reverting. In the current market structure though most flows are passive or are strategies such as momentum strategies which follow passive flows. Passive flows will indiscriminately buy regardless of price and bad news hitting the tape will not stop passive from buying. This means that it creates momentum to the upside with no regard for price. Because of this, the forward-looking indicator that is the market becomes lagging. It isn’t till unemployment goes up and flows into the market stop that the equity market sharply reverses.
This goes back to the theme of higher rates, as the Fed and government would normally rely on markets to give them a signal. Now though the Fed board is more likely to believe that all is well as the equity market hasn’t dropped significantly and by the time it does the economy will already be in dire straits. This increases the timeline for the Fed to pivot, as we would first have to see a recession, which would cause flows to reverse in the market, which then would cause the Fed to pivot. If this were to start right now it could take a full year till the Fed pivots, and potentially longer if a recession is a long way away.
Yield Curve Steepening Prior To Recession
Above I mention that a recession would likely be the first step of many to see a Fed pivot. A clear sign that a recession is coming is the inverted yield curve. Currently, the 2-year is at 4.5%, 5-year at 3.9%, 10-year at 3.7%, and 30-year at 3.9%. The front end of the curve is inverted and previously even the long end of the curve was inverted. Since we’ve seen the long end flatten from an inversion but the front end is still inverted. Normally when a recession is about to happen rates on the front end will collapse while those on the long end of the curve will be stable causing the yield curve to become steep. This generally happens during the first quarter of a recession. While we’ve seen the 10-30 spread positive, everything prior to the 10-year is still inverted meaning a recession is still a ways away. This is another sign that a Fed pivot is a long way away and rates will continue higher for longer.
Trades For This Thesis
There are various interesting trades that can be put on for this thesis of higher rates for longer. Firstly there is the front end of the curve which is just a pure play on what the Fed will do. The easiest way to bet on where Fed Funds are headed is to use Fed Funds Futures, and if one wanted to trade options on a more liquid market then I would recommend the Eurodollar market; another plus with the Eurodollar market is the risk of the Ted Spread blowing up and furthering the spread between LIBOR and Fed Funds which would benefit this trade.
My favourite way though to play this trade thesis is on the longer end of the curve. Unlike the short end of the curve, the long end provides convexity through duration so even a minuscule rise in rates will provide a large drawdown in bonds. Moreover, due to the invention of the yield curve, the long bond actually has a negative carry which helps shorts get a positive carry and the yield curve has historically uninverted prior to a recession which would send yields on the long end higher.
For something mid-curve like the 10-year, I would just short it through the /ZN futures contract, or if one prefers an ETF trade, short IEF or long TBX which is the inverse ETF.
Since the very long end of the curve has more convexity I would prefer an options trade to limit risk. The easiest way to put on an options trade would be to buy put spreads expiring 8-10 months from now on the /ZB; if an ETF is preferred buy put spreads on the TLT or call spread on the TBF.
The Bottom Line
The bottom line here is the same as that of the title of this piece: rates will be higher for longer. This is because the only way to solve fiscally driven inflation with monetary policy is to crush the credit market by helping to create more defaults and to crush consumer spending. Even though the Fed board would like to say they have the “tools” to lower inflation, they really don’t when inflation is driven by high-velocity fiscal spending. On top of that when you’re a hammer everything looks like a nail; the hammer being the Fed and the nail being inflation, while the mechanism used to knock the nail down is rate hikes. This can all be seen in the data as inflation is sticky around 5% and with a likely bottom in commodity prices, it is unlikely to go down further without significant tightening of financial conditions. To add to all of this the response mechanism of the market has reversed so that a recession would have to start first before a market downturn whilst the yield curve is indicating that a recession is still a ways away, so there will be a heck of a lot more rate hikes till we get there.
Credit: Source link