
• bitcoinBitcoin(BTC)$81,238.006.48%
  • ethereumEthereum(ETH)$2,629.557.70%
  • tetherTether(USDT)$1.000.04%
  • binancecoinBNB(BNB)$763.484.08%
  • rippleXRP(XRP)$1.408.51%
  • usd-coinUSDC(USDC)$1.000.02%
  • solanaSolana(SOL)$113.3512.22%
  • tronTRON(TRX)$0.3385521.22%
  • zcashZcash(ZEC)$1,503.192.63%
  • Figure HelocFigure Heloc(FIGR_HELOC)$1.031.39%
  • HyperliquidHyperliquid(HYPE)$92.0410.66%
  • dogecoinDogecoin(DOGE)$0.0884188.69%
  • moneroMonero(XMR)$574.6312.07%
  • whitebitWhiteBIT Coin(WBT)$83.305.91%
  • USDSUSDS(USDS)$1.000.02%
  • RainRain(RAIN)$0.0135015.73%
  • chainlinkChainlink(LINK)$12.419.92%
  • cardanoCardano(ADA)$0.22540512.48%
  • leo-tokenLEO Token(LEO)$8.91-0.20%
  • stellarStellar(XLM)$0.1935325.33%
  • uniswapUniswap(UNI)$8.9618.46%
  • bitcoin-cashBitcoin Cash(BCH)$258.5311.49%
  • nearNEAR Protocol(NEAR)$3.6922.44%
  • Ethena USDeEthena USDe(USDE)$1.000.05%
  • daiDai(DAI)$1.000.00%
  • litecoinLitecoin(LTC)$57.025.92%
  • CantonCanton(CC)$0.11119410.87%
  • USD1USD1(USD1)$1.000.05%
  • the-open-networkGram (prev. Toncoin)(GRAM)$1.383.00%
  • avalanche-2Avalanche(AVAX)$8.248.81%
  • hedera-hashgraphHedera(HBAR)$0.0792136.17%
  • suiSui(SUI)$0.8211.80%
  • Global DollarGlobal Dollar(USDG)$1.00-0.01%
  • shiba-inuShiba Inu(SHIB)$0.0000057.92%
  • MemeCoreMemeCore(M)$1.3211.60%
  • crypto-com-chainCronos(CRO)$0.0597544.40%
  • BittensorBittensor(TAO)$249.619.16%
  • paypal-usdPayPal USD(PYUSD)$1.000.03%
  • tether-goldTether Gold(XAUT)$4,377.140.81%
  • Circle USYCCircle USYC(USYC)$1.140.03%
  • okbOKB(OKB)$116.784.14%
  • Ripple USDRipple USD(RLUSD)$1.000.00%
  • BlackRock USD Institutional Digital Liquidity FundBlackRock USD Institutional Digital Liquidity Fund(BUIDL)$1.000.00%
  • Ondo US Dollar YieldOndo US Dollar Yield(USDY)$1.14-0.23%
  • aaveAave(AAVE)$138.698.84%
  • AsterAster(ASTER)$0.773.53%
  • mantleMantle(MNT)$0.6310.30%
  • Pump.funPump.fun(PUMP)$0.00438210.20%
  • OndoOndo(ONDO)$0.3985397.93%
  • polkadotPolkadot(DOT)$1.147.46%
TradePoint.io
  • Main
  • AI & Technology
  • Stock Charts
  • Market & News
  • Business
  • Finance Tips
  • Trade Tube
  • Blog
  • Shop
No Result
View All Result
TradePoint.io
No Result
View All Result

Rate Decreases: Be Careful What You Wish For?

February 4, 2024
in Market & News
Reading Time: 4 mins read
A A
Rate Decreases: Be Careful What You Wish For?
ShareShareShareShareShare

Andriy Onufriyenko/Moment via Getty Images

By Michael J. Fleisher

Since early 2022, the Federal Reserve (FED) lifted the federal funds rate by 5.25% to curb inflation, triggering speculation from pundits over the economic impact and future path of rate increases. Recently, the Fed noted that inflation has been tempered by restrictive monetary policy and signaled the likelihood of easing monetary policy this year. Equity investors applauded this dovish pivot with a relief rally toward the end of 2023. However, beyond the market response to early signals of a potential decrease in the federal funds rate, we wanted to research the behavior of equities after the Fed actually lowers rates. Furthermore, we wanted to see if the decrease in rates can be used as a signal for future market behavior. In this research, we look at the trailing 12-month change in the federal funds rate going back to the mid-1970s to analyze market returns after the Fed has commenced easing.

The chart below shows that the U.S. equity market, as measured by the Russell 1000 Index from December 31, 1974, to December 31, 2023, on average, records similar returns relative to its long-term history one year after the 12-month change in rates becomes negative (see Exhibit 1). However, when looking at each individual period of decreasing rates, the market outperformed its long-term average in 6 out of 11 occurrences with an average 24% return. Intuitively, it makes sense that the market would outperform as the Fed lowers rates to stimulate the economy. When looking at the remaining 5 out of 11 periods during which the market underperformed its long-term average, we find that these subpar occurrences had an average return of -5.21%, and the performance for 3 of these 5 underperforming time spans resulted in negative returns. Also, these negative return periods occurred within 12 months of an inverted yield curve. As we briefly explained in our last analysis, the yield curve can un-invert as the Fed lowers short-term rates. The inverted yield curve has been a good predictor of recessions, and when followed by monetary easing, lower rates may be a more coincident indicator of worsening economic data and a struggling economy.
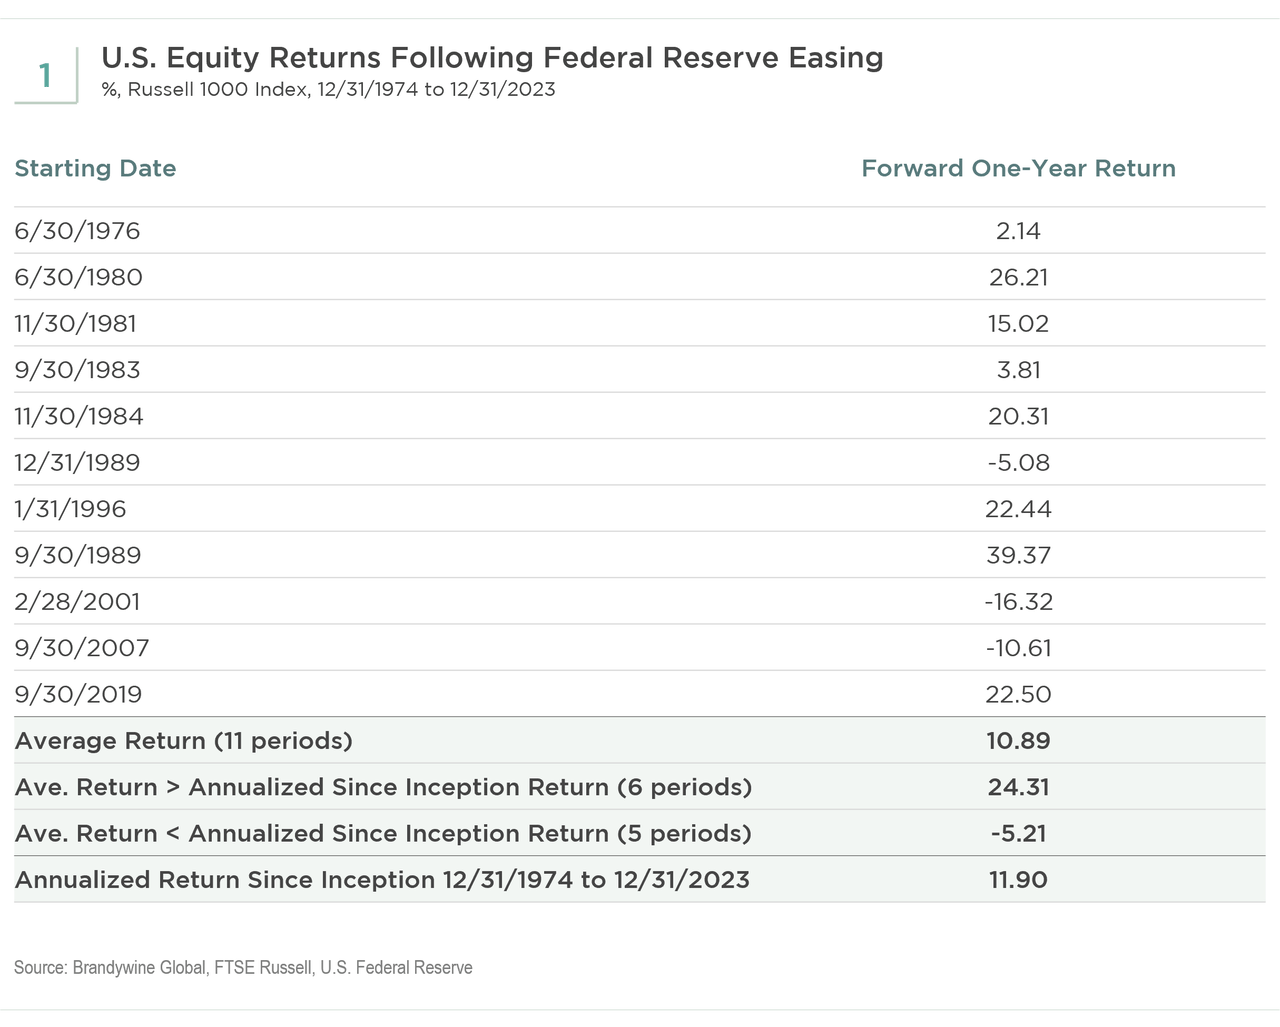
US Equity Returns Following Federal Reserve Easing

We looked at all periods from 1975 until 2023 in which both the 12-month change in the federal funds rate was first negative and the curve had been inverted within the prior 12 months. The below chart (see Exhibit 2) shows that the market, on average, underperformed with an average return of 5.29% versus the long-term average of 11.90%. Furthermore, the underperformance persisted on average when looking at 2-year annualized returns, with the average return dropping to 4.63%. The market underperformed for 24 months out in 4 of the 6 periods when the Fed lowered rates within 12 months of an inverted yield curve.

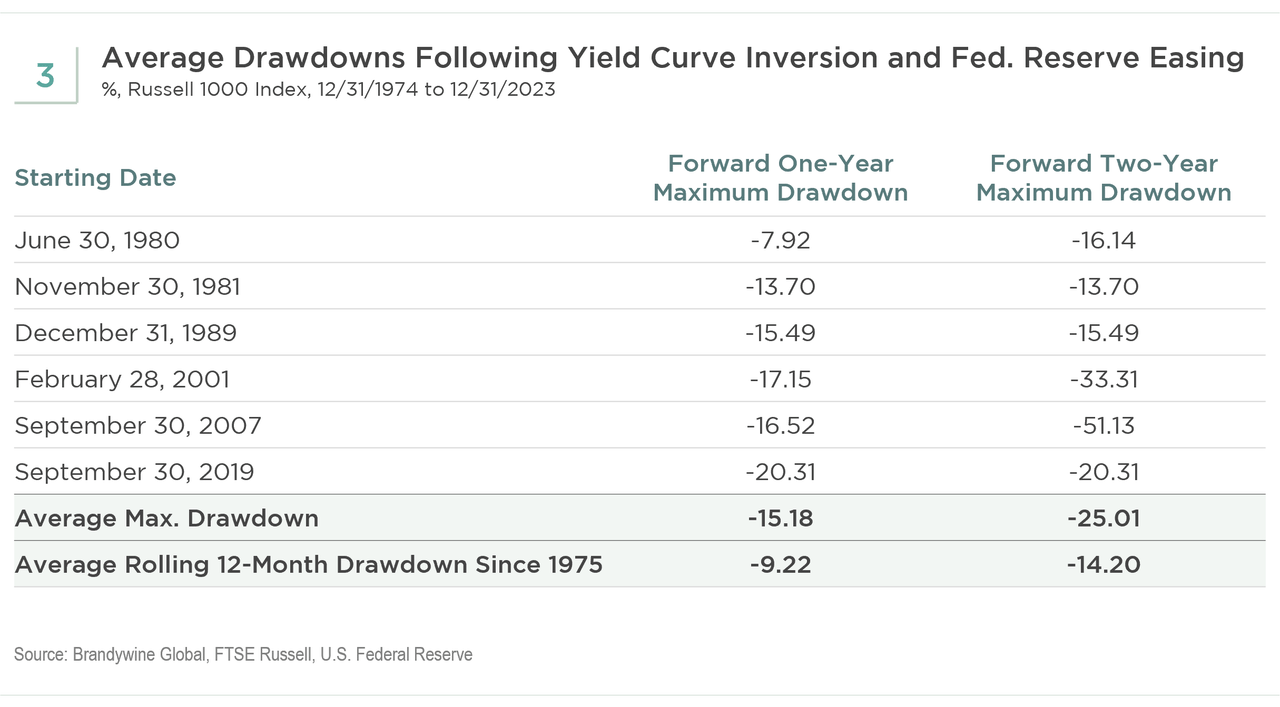
We also looked at the maximum drawdown during each decreasing rate period after an inverted curve. As seen in Exhibit 3, the average one-year maximum drawdown during these time periods underperforms the average maximum one-year drawdown for the full research history. When looking at maximum two-year drawdowns, the average return is much lower and underperforms the maximum two-year drawdown in five of the six periods. Regardless of the full-year returns, the maximum drawdowns help to quantify the volatility that can occur when the Fed lowers rates close to inverted yield curves and/or recessions. For example, after September 30, 2019, the one-year return of the market was 22.5% (Exhibit 2). However, the maximum drawdown that occurred was -20.31% in just two months as a result of the COVID-19 pandemic (see Exhibit 3).
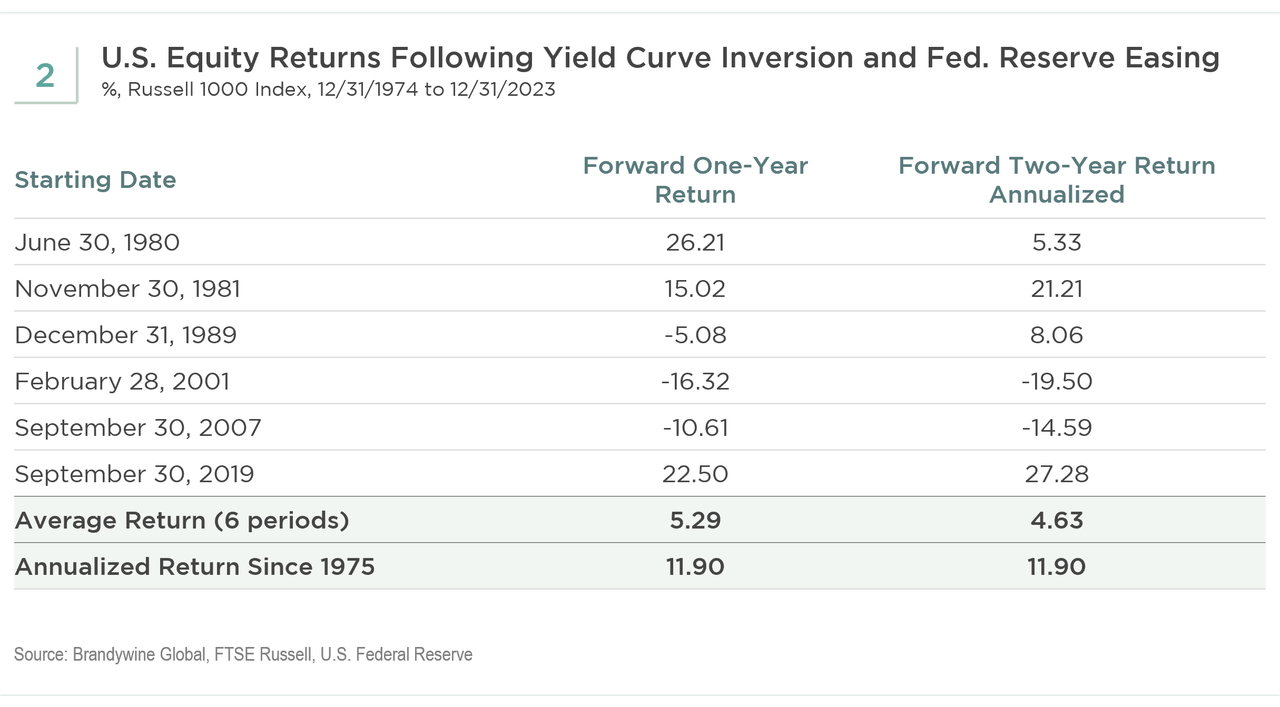
US Equity Returns Following Yield Curve Inversion and Fed Reserve Easing
Average Drawdowns Following Yield Curve Inversion and Fed Reserve Easing

There has been much discussion around whether the U.S. is headed for a recession. Increasingly, some investors believe the Fed has been nimble enough to orchestrate a soft landing for the economy. However, the yield curve remains inverted, although well off-peak inversion levels, despite the Fed signaling its likelihood to lower rates this year. While there are only 11 data points of trending declines in interest rates, we get an understanding that the results in the equity markets have been mixed when rates have decreased. When looking at the charts, we see that when rates are decreasing and there has been an inverted yield curve, a bear market – most likely from a recession – may occur. However, the decrease in rates may be a lagging indicator of a poor economy. Meanwhile, investors already may have reacted proactively to poor expectations, whether it was a weak economy or higher inflation-delaying rate decreases. While we do not know exactly when the Fed will lower rates, historically, after the curve has been inverted, monetary easing coincides with elevated market volatility.

The Russell 1000® Index measures the performance of the large-cap segment of the U.S. equity universe. It is a subset of the Russell 3000® Index and includes approximately 1,000 of the largest securities based on a combination of their market cap and current index membership.

YOU MAY ALSO LIKE

Hundreds of teens swarm Colorado shopping center for so-called ‘takeover’

Video shows people on the ground during Minneapolis shooting

Original Post

Editor’s Note: The summary bullets for this article were chosen by Seeking Alpha editors.

Credit: Source link

ShareTweetSendSharePin

Related Posts

Hundreds of teens swarm Colorado shopping center for so-called ‘takeover’
Market & News

Hundreds of teens swarm Colorado shopping center for so-called ‘takeover’

September 18, 2026
Video shows people on the ground during Minneapolis shooting
Market & News

Video shows people on the ground during Minneapolis shooting

September 18, 2026
Stock Market Today: Dow Steady, Yields Edge Higher — Live Updates – WSJ
Market & News

Stock Market Today: Dow Steady, Yields Edge Higher — Live Updates – WSJ

September 18, 2026
Minneapolis shooting leaves two dead and three officers injured
Market & News

Minneapolis shooting leaves two dead and three officers injured

September 18, 2026
Next Post
‘Heat seekers’ revel in Death Valley’s record temperatures

'Heat seekers' revel in Death Valley's record temperatures

Leave a Reply Cancel reply

Your email address will not be published. Required fields are marked *

Search

No Result
View All Result
NBC Nightly News with Tom Llamas Full Episode – Sept. 3

NBC Nightly News with Tom Llamas Full Episode – Sept. 3

September 17, 2026
First responder from 9/11 shares never-before-seen photos from ground zero

First responder from 9/11 shares never-before-seen photos from ground zero

September 12, 2026
Clancy’s lawyer says she has no anger toward anyone in trial

Clancy’s lawyer says she has no anger toward anyone in trial

September 15, 2026

About

Learn more

Our Services

Legal

Privacy Policy

Terms of Use

Bloggers

Learn more

Article Links

Contact

Advertise

Ask us anything

©2020- TradePoint.io - All rights reserved!

Tradepoint.io, being just a publishing and technology platform, is not a registered broker-dealer or investment adviser. So we do not provide investment advice. Rather, brokerage services are provided to clients of Tradepoint.io by independent SEC-registered broker-dealers and members of FINRA/SIPC. Every form of investing carries some risk and past performance is not a guarantee of future results. “Tradepoint.io“, “Instant Investing” and “My Trading Tools” are registered trademarks of Apperbuild, LLC.

This website is operated by Apperbuild, LLC. We have no link to any brokerage firm and we do not provide investment advice. Every information and resource we provide is solely for the education of our readers. © 2020 Apperbuild, LLC. All rights reserved.

No Result
View All Result
  • Main
  • AI & Technology
  • Stock Charts
  • Market & News
  • Business
  • Finance Tips
  • Trade Tube
  • Blog
  • Shop

© 2023 - TradePoint.io - All Rights Reserved!