

zbruch
Investment Thesis
First Trust NASDAQ-100-Technology Sector Index Fund ETF (NASDAQ:QTEC) warrants a buy rating due to its equal-weighted strategy in the technology sector. Despite having a much lower weight on mega-cap, big tech companies like Apple Inc. (AAPL) or Microsoft Corporation (MSFT), QTEC has performed surprisingly well. Additionally, QTEC is uniquely postured to take advantage of multiple key tech holdings that have released recent AI-driven devices and initiatives.
Fund Overview and Compared ETFs
QTEC is an ETF that seeks to track the performance of the Nasdaq-100 Technology Sector Index. With an inception in 2006, the fund has 42 holdings and $3.68B in AUM. The fund is equal weighted and rebalances quarterly. QTEC’s greatest industry exposure is on software (41.46%), semiconductors (31.92%), and consumer digital services (9.95%). For comparison purposes, other technology ETFs examined are the Vanguard Information Technology ETF (VGT), Invesco QQQ ETF (QQQ), and the Invesco S&P 500 Equal Weight Technology ETF (RSPT).
VGT seeks to track the investment returns of the information technology sector in general. Vanguard’s fund has the greatest industry weights in systems software (25.30%), technology hardware (23.10%), and semiconductors (19.30%). QQQ tracks the Nasdaq-100 Index and works to match the performance of the 100 largest non-financial companies on the Nasdaq. QQQ, like VGT, is cap weighted. RSPT is made up of equal weighted stocks in the IT sector of the S&P 500 Index.
Performance, Expense Ratio, and Dividend Yield
The 10-year compound annual growth rate, or CAGR, for QTEC is 18.20%. This is notably higher than equal-weighted tech ETF, RSPT, which has a 10-year CAGR of 16.70%. Additionally, QTEC has outperformed cap weighted QQQ over the past 10 years which has seen a 17.39% CAGR. Only Vanguard’s VGT has a higher 10-year CAGR at 19.83%.
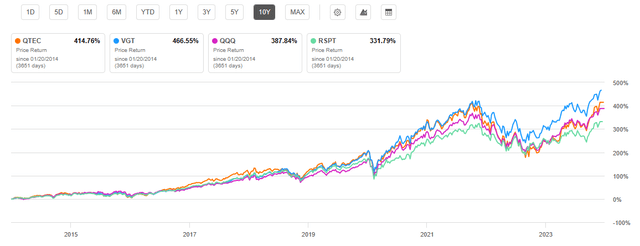
10 Year Total Price Return for QTEC and Compared Tech ETFs (Seeking Alpha)
One downside for QTEC is its expense ratio which is higher than all other tech ETFs examined at 0.57%. Additionally, QTEC has a low dividend yield at just 0.13%. However, this is on par for tech ETFs compared which all have dividend yields below 1.0%. Additionally, QTEC’s dividend yield has been declining with a 5-year CAGR of -17.30%.
Expense Ratio, AUM, and Dividend Yield Comparison
|
QTEC |
VGT |
QQQ |
RSPT |
|
|
Expense Ratio |
0.57% |
0.10% |
0.20% |
0.40% |
|
AUM |
$3.68B |
$69.35B |
$238.88B |
$3.61B |
|
Dividend Yield TTM |
0.13% |
0.63% |
0.55% |
0.55% |
|
Dividend Growth 5 YR CAGR |
-17.30% |
7.71% |
10.55% |
5.82% |
Source: Seeking Alpha, 21 Jan 24
QTEC Holdings and Its Competitive Advantage
Because QTEC, like RSPT, is equal weighted versus cap weighted, the top 10 holdings and their respective weights differ greatly from VGT and QQQ. Although QTEC does have mega-cap, big tech companies like NVIDIA Corporation (NVDA), Meta Platforms, Inc. (META), and MSFT in its top holdings, the fund holds significantly lower weight on these holdings compared to cap-weighted funds.
Top 10 Holdings for QTEC and Peer Technology ETFs
|
QTEC – 42 holdings |
VGT – 312 holdings |
QQQ – 101 holdings |
RSPT – 66 holdings |
|
AMD – 2.92% |
AAPL – 21.47% |
AAPL – 8.95% |
AMD – 1.96% |
|
NVDA – 2.84% |
MSFT – 19.75% |
MSFT – 8.93% |
JNPR – 1.87% |
|
MRVL – 2.78% |
NVDA – 4.20% |
AMZN – 4.84% |
AVGO – 1.86% |
|
META – 2.67% |
AVGO – 3.86% |
NVDA – 4.30% |
NVDA – 1.81% |
|
ANSS – 2.66% |
ADBE – 2.11% |
AVGO – 4.21% |
TER – 1.70% |
|
CRWD – 2.60% |
CRM – 2.00% |
META – 4.05% |
ANET – 1.70% |
|
PANW – 2.56% |
AMD – 1.86% |
TSLA – 3.11% |
LRCX – 1.70% |
|
CDNS – 2.51% |
ACN – 1.72% |
GOOGL – 2.59% |
ANSS – 1.70% |
|
MU – 2.51% |
INTC – 1.65% |
GOOG – 2.53% |
MU – 1.69% |
|
MSFT – 2.51% |
CSCO – 1.60% |
COST – 2.40% |
FTNT – 1.69% |
Source: Multiple, compiled by author on 21 Jan 24
All ETF investors know that a fund’s future performance is tied to the returns of its individual holdings. QTEC is no different and has several key holdings that present advantages over its peer tech competitors. These advantages are its comparatively higher weight on Advanced Micro Devices, Inc. (AMD), Marvell Technology, Inc. (MRVL), and META. I will cover why each of these holdings represent advantages for QTEC below.
AMD – Strong Potential for Automotive Artificial Intelligence
The first advantage for QTEC in comparison to its peers is its heaviest weight (2.92%) on AMD. Despite a 157% return over the past year, the company is primed for more returns and has made recent advancements in automotive artificial intelligence. Just earlier this month at the Consumer Electronics Show, AMD released two new devices, the Versal AI Edge XA adaptive system-on-a-chip and Ryzen embedded V2000A series processor. These advancements are critical in automotive cameras progressing automated parking and autonomous driving. AMD estimates that shipments of highly automotive vehicles will grow at a 41% CAGR between 2024 and 2030, posturing the company for strong returns looking forward.
MRVL – Growing Contender in Big Tech
The second difference is QTEC’s inclusion of Marvell. This IT company provides data infrastructure semiconductor solutions and has seen a one-year price return of 84%. QTEC is the only tech fund examined that has MRVL at a top 10 holding. As a credit to the company’s potential, Citi Research recently made Marvell Technology its number one pick, ahead of NVIDIA. The analysts’ rationale for this move is the expected importance of non-cloud markets such as enterprise networking. The company is highly profitable with a 42.1% gross profit margin and 18.17% EBITDA margin over the past year. Despite impressive recent returns, MRVL appears postured to have momentum continuing through 2024.
META – A Mega-Cap Comeback
The third difference is META. While QTEC has only a 2.67% weight on META, VGT and RSPT do not have META in their top 10 holdings. Despite problems with the Metaverse in 2022, and a subsequent layoff of 13% of the company’s workforce, META saw a stellar rebound in 2023. The company has demonstrated very strong fundamentals recently including a 23.4% net income margin and a 24.4% YoY EBITDA growth. META has also successfully launched multiple AI-driven initiatives including Ray-Ban smart glasses which include Meta AI features. Due to its renewed focus on efficiency and AI projects, META will therefore likely propel ETFs that have it as a holding. Because META is in the communications services sector, many information technology ETFs do not include META as a holding. This represents a distinct strength for QTEC compared to VGT.
Valuation and Risks to Investors
QTEC is currently trading at $181.66 at the time of writing this article. This price is currently at its all-time high and at the top of its 52-week price range of $113.09 to $181.66. The one-year performance of QTEC has been superior to peers at a 65.33% return. This performance far outpaces other equal-weighted ETF, RSPT, and is even greater than cap-weighted tech ETFs.
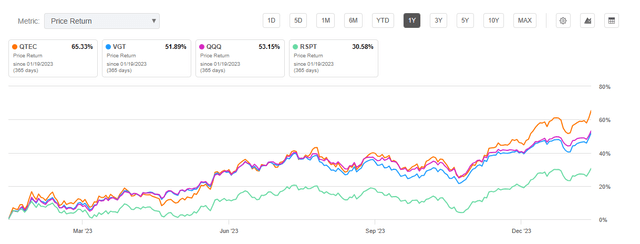
One Year Price Return: QTEC and Peer Tech ETFs (Seeking Alpha)
When comparing valuations for QTEC and its peer competitors, the fund does indicate a higher price-to-earnings ratio at 34.18. However, the ETF also has a price-to-book ratio lower than cap-weighted tech ETFs. Despite a higher P/E ratio, I expect QTEC to perform at least on par with its historic returns looking forward. This is a direct result of its strong holdings as mentioned previously.
Valuation Metrics for QTEC and Peer Competitors
|
QTEC |
VGT |
QQQ |
RSPT |
|
|
P/E ratio |
34.18 |
34.10 |
32.52 |
21.10 |
|
P/B ratio |
7.50 |
8.40 |
16.58 |
4.54 |
Source: Compiled by Author from Multiple Sources, 21 Jan 24
A major drawback for any of the tech ETFs mentioned is their increased volatility. This can be measured by looking at each fund’s beta value. QTEC has a 3-year beta value of 1.26, indicating that it has noticeably greater volatility than “the market” overall. However, this is not uncommon for tech-focused funds as QQQ’s 5-year beta is 1.11 and VGT’s beta is 1.24. In addition to volatility, big tech companies and the artificial intelligence industry have seen impressive returns over the past six months. Investors should be cautioned that any significant correction from these highs will hit QTEC and the compared tech ETFs particularly hard.
Concluding Summary
QTEC is an equal-weighted exchange traded fund focusing on technology holdings. Despite its equal-weighted strategy, as opposed to cap-weighted, its long-term performance has beaten peer tech ETFs in most time periods. QTEC has a strong holding mix currently including AMD, MRVL, and META which all have unique strengths looking forward. Drawbacks for QTEC are its comparatively high expense ratio, low dividend yield, and higher P/E ratio compared to peer tech ETFs. However, I expect the fund to continue to perform well looking forward, potentially seeing greater returns than its cap-weighted tech peers. Therefore, while all examined tech ETFs included in this article are solid choices, QTEC warrants a buy rating.
Credit: Source link