

ClaudioVentrella
The latest BofA Global Fund Manager Survey revealed an interesting capital allocation preference shift. More portfolio managers now want companies to put cash flow toward capex investing. It was the largest sequential percentage increase since September 2022, per BofA. Will there be more pressure put on Energy sector firms to use cash to drill for more oil & gas? That remains to be seen, but there is no question where some of the market’s biggest free cash flow yields are right now: Energy.
I have a buy rating on shares of Pioneer Natural Resources (NYSE:PXD) for its significant FCF yield and attractive valuation, but I note some concerning technical trends.
Capex Plans Ahead?
BofA Global Research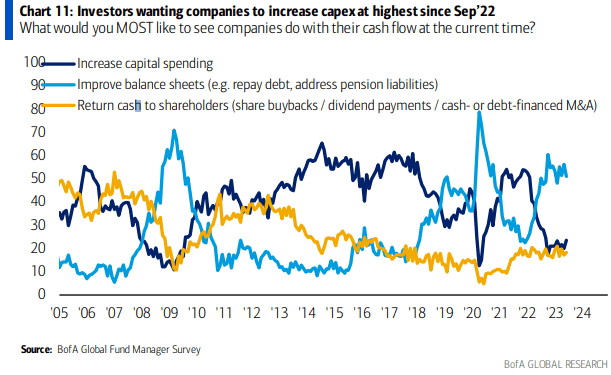
According to Bank of America Global Research, PXD is a producer of oil and natural gas with principal operations in the Permian Basin and the Eagle Ford Shale. The company explores for, develops, and produces oil, natural gas liquids (NGLs), and gas. It has operations in the Midland Basin in West Texas. Its portfolio is weighted towards oil and has significant upside potential stemming from a large position in the Wolfcamp Shale.
The Texas-based $47.1 billion market cap Oil and Gas Exploration and Production industry company with the Energy sector trades at a low 7.2 trailing 12-month GAAP price-to-earnings ratio and pays a moderate 2.5% dividend yield, according to The Wall Street Journal.
Back in April, PXD reported an EPS beat on lower operating costs. Cash flow was about what analysts had expected, but a key risk lies ahead with added taxes paid due to a shift to a full cash-tax paying construct. The management team expects an average cash tax rate around the high teens, above the AMT rate of 15%.
The bigger story on April 27 was a more dour outlook on a potential takeover. There had been rumors that the sector stalwart Exxon Mobil may look to acquire the E&P name. So, it makes sense that shares have traded poorly since the Q1 report. But could there be a ray of hope for the takeover bulls? A CFTN report this past Monday suggested that Permian players could be the targets of activist investors. That is something to consider as the summer ensues.
On valuation, analysts at Bank of America Global Research see earnings falling 28% this year after a massive jump in 2022. Per-share profits are then expected to grow at a more modest pace looking to the out year and 2025. The Bloomberg consensus forecast sees rolling 12-month EPS being around the $22 mark while dividends are expected to rise toward $5.50 per share by 2025.
The stock is lower on the year, so the valuation situation has generally improved while the yield has inched higher. With an EV/EBITDA ratio about half that of the broad market, the company appears on the cheap. Free cash flow is forecast to remain robust over the coming quarters as profitability stabilizes.
Pioneer: Earnings, Valuation, Dividend, Free Cash Flow Forecasts
BofA Global Research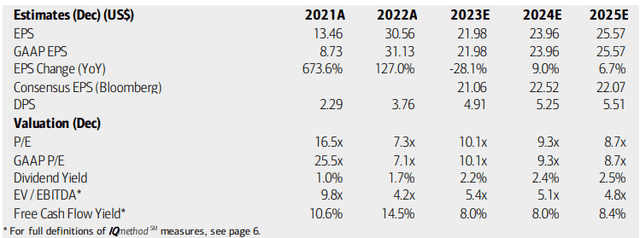
PXD now trades with a single-digit trailing and forward P/E while its price-to-cash flow ratio is at a 12% discount to the 5-year average. If we apply $22 of next-12-month EPS to the sector-median 8.7 multiple, then the stock should be near $191, but I assert that the Energy sector as a whole is sharply undervalued, so tacking on about 20% to that yields a target near $230.
PXD: Forward P/E Now In the Single Digits
Seeking Alpha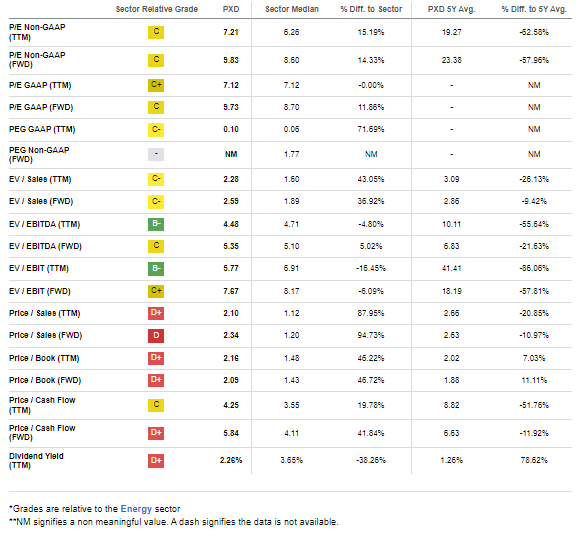
Looking ahead, corporate event data provided by Wall Street Horizon show a quiet calendar ahead. The only notable volatility catalyst is Pioneer’s August 1, 2023, Q2 earnings date.
Corporate Event Risk Calendar
Wall Street Horizon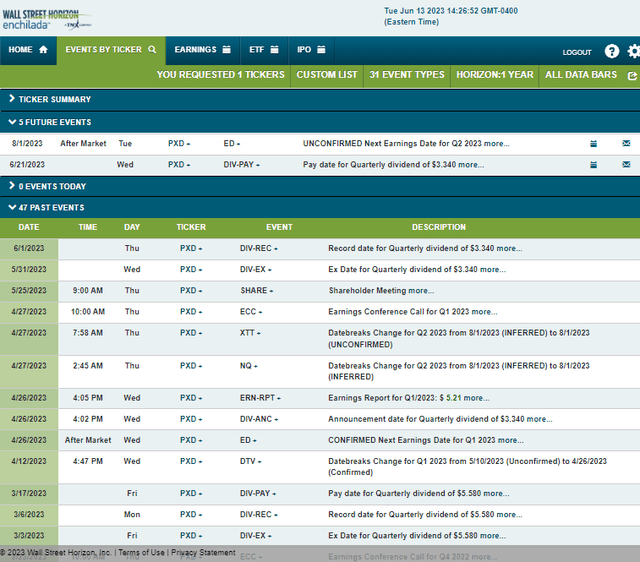
The Options Angle
Digging into the upcoming earnings report, data from Option Research & Technology Services (ORATS) show a consensus EPS forecast of $4.84 which would be a massive 48% decline from $9.36 of per-share profits earned in the same quarter a year ago, but the comp is also back when WTI crude oil and Henry Hub natural gas prices were at or near their peaks. PXD has topped analysts’ EPS forecasts in 6 of the past 7 quarters, but shares have traded lower post-earnings in 3 of the previous 4 instances. So that is not an overly compelling trend from the long side.
This time around, the options market has priced in a 5.6% earnings-related stock price swing when analyzing the at-the-money straddle expiring soonest after the August report. Shares have barely budged post-earnings lately, and with just 27% implied volatility now, I am inclined to avoid paying up for that premium.
PXD: Earning Decline Underway, But EPS Troughing
ORATS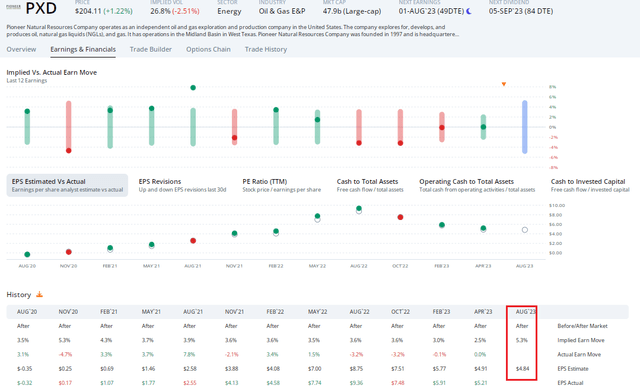
The Technical Take
While I like the cash flow situation and valuation, the chart is less intriguing from a bullish perspective. Notice in the graph below that PXD now features a declining 200-day moving average with the 50-day below the 200-day. Both are bearish trend signals. Moreover, there was a volume spike in late March and early April when the stock was on the move lower.
I see resistance near $232 – the April rebound high – while there’s near-term support around $200. A false breakdown to $177 could be a further buy point. I see long-term support in the $150 to $165 area care of a high amount of volume by price from back in 2021, so if we see the stock drop to that zone, backing up the truck, so to speak, could be worth it from a risk management perspective.
PXD: Hanging Near Key Support
Stockcharts.com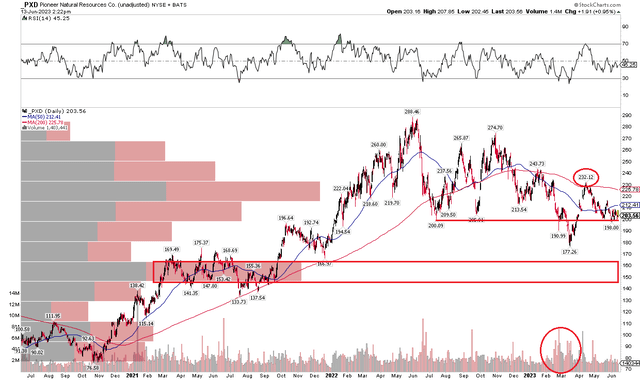
The Bottom Line
Despite the dicey chart, I have a buy rating on Pioneer for its compelling valuation and strong free cash flow.
Credit: Source link