

Jose Luis Pelaez Inc/DigitalVision via Getty Images
Intro
We wrote about Pilgrim’s Pride Corporation (NASDAQ:PPC) (Chicken & Pork Distributor) in December last year when we reiterated our ‘Hold’ rating in the packaged food outfit. Shares, however, have continued their ascent in recent months with the stock now up over 75% since their June lows of last year & 37%+ since our most recent commentary. We flagged this in December when we stated that Pilgrim’s Pride still had upside potential as shares had not yet reached significant long-term overhead resistance as we see below.
Probably the most revealing long-term technical indicator is the bearish divergence of Pilgrim’s MACD indicator to the company’s share-price action. The MACD indicator is especially noteworthy on long-term charts due to the amount of information that gets digested and the fact that it measures both the momentum & trend of Pilgrim’s Pride. Suffice it to say, the bearish divergence dates back to 2014 which in our eyes diminishes Pilgrim’s chances of breaking through overhead resistance with any kind of authority.
PPC Long-Term Technicals (Stockcharts.com)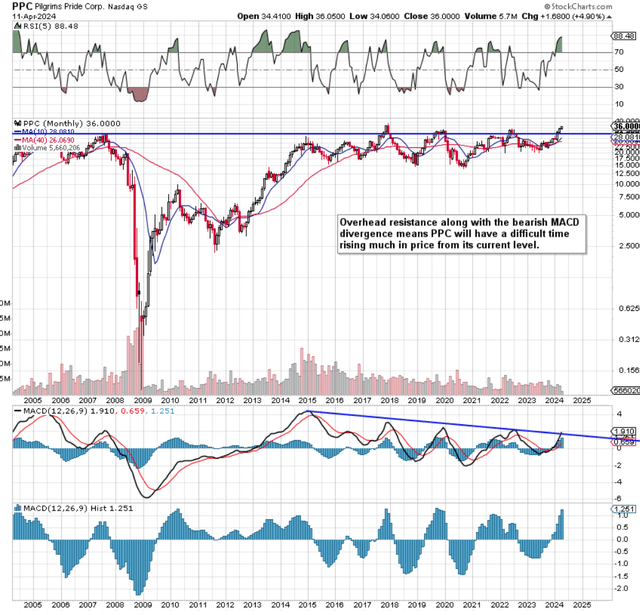
To validate what we are seeing on the technicals, Pilgrim’s profitability and valuation trends should not point to an undervalued play ready to go a sustained bullish run.
Constrained Profitability & Growth Trends
PPC management quotes EBITDA & adjusted EBITDA metrics in its earnings reports which in our opinion does not give an accurate reflection of the company’s underlying profitability. The reason is that the company shells out a significant amount of money on CAPEX each year which was to the tune of over $540 million in fiscal 2023 alone. Therefore although the company’s stated adjusted EBITDA margin remained above 5% in fiscal 2023, the net profit margin dropped to 1.85% (5-year average of 2.09%). This is key for the following reasons.
Pilgrim’s financials stem from a company’s sales curve to the extent that top-line growth drives the income statement over time. For fiscal 2023, net revenues came in at $17.36 billion which was slightly down on the previous year’s $17.46 billion. Although consensus is pricing in bottom-line growth over the next few years, this growth will have to take place in the absence of top-line sales growth which is worrying. Top-line projections from fiscal 2024 onward only amount to a low single-digit growth curve (1 to 3% on average annually) which essentially means ongoing cost-cutting initiatives will have to be successful over time (concerning).
PPC Consensus Revisions Trend (Seeking Alpha)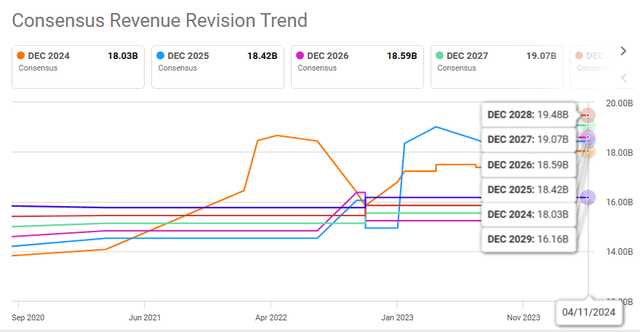
Secondly, a higher cost environment in fiscal 2023 resulted in a gross profit of approximately $1.19 billion, equating to a gross margin of 6.44%. Pilgrim’s 5-year average for this key profitability metric comes in at 8.34% Therefore the worrying aspect from an investor’s standpoint is that if the cost of revenues continues to grow, it will put serious pressure on Pilgrim’s bottom-line profitability further down the income statement (all things remaining equal). We state this because given the extremely low margins in this industry, every basis point lost in gross margin is bound to work itself down to Pilgrim’s net profit tally over time.
Suffice it to say, struggling margins & mute top-line sales growth coincide with what we see in Pilgrim’s technicals alluded to above. Given how this industry can change on a dime, as chartists, we believe that every piece of known fundamental info has already been priced into PPC’s share-price action on the technical chart at this stage. This means trends in pricing, supply/demand chicken dynamics & how forward-looking pork and beef production will affect chicken demand have already been digested by the market at this stage. Furthermore, given Pilgrim’s below-average margins, investors are fully aware that return on capital numbers will only gain traction if the company’s product can be rolled over at a faster clip going forward.
Balance-Sheet Leverage
A company’s balance sheet and specifically the trend of how the stock’s debt compares to its equity is a significant valuation driver of the company over time. At the end of fiscal 2023, PPC reported long-term debt of almost $3.34 billion & shareholder equity of practically the same number ($3.34 billion). This means that the reported debt-to-equity ratio of Pilgrim’s Pride equates to approximately 1 which to many value investors is not a bad starting point when evaluating the investment case of a stock.
However, when calculating the debt-to-equity ratio, we like to exclude goodwill & intangible assets which currently amount to $2.14 billion (combined). Since these assets are not tangible (making them far more susceptible to being reduced in value over time through potential impairment charges), our adjusted debt-to-equity ratio now comes in at a much higher 2.77. Suffice it to say, given how Pilgrim’s long-term debt continues to grow, this puts more pressure on those goodwill & intangible-asset line items to maintain their value over time.
Our above concerns concerning Pilgrim’s balance sheet stem from the company’s significant capex budget mentioned earlier. Although PPC continues to generate strong operating cash-flow numbers ($678 million in fiscal 2023), the lion’s share of this cash is going towards the capex budget. In fiscal 2023 for example, elevated amounts of cash were ploughed into plants at Mayfield, Kentucky & Athens, Georgia. Furthermore, a further $500 million is expected to be spent on capital spending in fiscal 2024. Therefore, investors need to ask themselves why this level of spending is not yielding enough fruit concerning Pilgrim’s growth numbers. We acknowledge that there are many factors outside of Pilgrim’s control but the risk here is if the company can not continue to invest aggressively over time. Therefore, with net interest expense amounting to an elevated $167 million in fiscal 2023, Pilgrim’s you feel has to start making a dent in its elevated debt. Fiscal 2024 will tell us a lot in this respect.
Conclusion
To sum up, we are maintaining our Hold rating in PPC due to rising leverage (which adversely affects the valuation of the stock) & constrained profitability. Furthermore, given how shares are now coming up against long-term multi-year technical resistance, the stock does not look cheap enough or profitable enough to be able to break through convincingly. Let’s see what Q2 numbers bring in early May. We look forward to continued coverage.
Credit: Source link