


PM Images
Overview
In an environment of higher interest rates, I believe that Business Development Companies are the right place to be! BDCs are a great way to offset the higher rates with a higher level of dividend income, since they direct profit from debt investments. Higher rates translate to higher interest you can collect from debt. PennantPark Floating Rate Capital (NYSE:PFLT) is one of the ways to capitalize on this interest rate environment due to their structure, strategy, and holdings.
Earlier this month I had an article published on PFLT’s brother fund, PennantPark Investment Corp. (PNNT) where I described how the 12% yield is supported by the total investment income may be affected by future rate changes, thereby a threat to the dividend. I ultimately rated PNNT a Hold for now, as I believe there may still be value there. I wanted to now visit PFLT to see if the same situation applies here.
PFLT has investments totaling $1.3B and has been around since 2011. The primary focus is investing in first lien senior secured debt. The main objective here is to generate high income while having a goal of capital preservation. PFLT focuses on middle market companies that have earnings between the ranges of $10M – $50M. I like PFLT’s approach because they target loans where the leverage multiples are low, which helps decrease the amount of risk involved with each investment.
Portfolio & Financials
The core difference between PFLT and PNNT is the portfolio focus and structure. PFLT has a larger base percentage of the portfolio as first lien senior secured debt, making up about 86% of their total portfolio. The remaining portion of their portfolio sits in preferred and common equities. This makes PFLT less “risky” in nature since it has a higher weighting towards first lien senior secured debt, which sits at a higher priority on the capital structure. This means that PFLT has a higher probability of repayment during portfolio company defaults and liquidations. In comparison, PNNT’s portfolio has a 58% weighting to first lien senior secured debt and a larger 22% weight in equities.
PFLT Q1 Presentation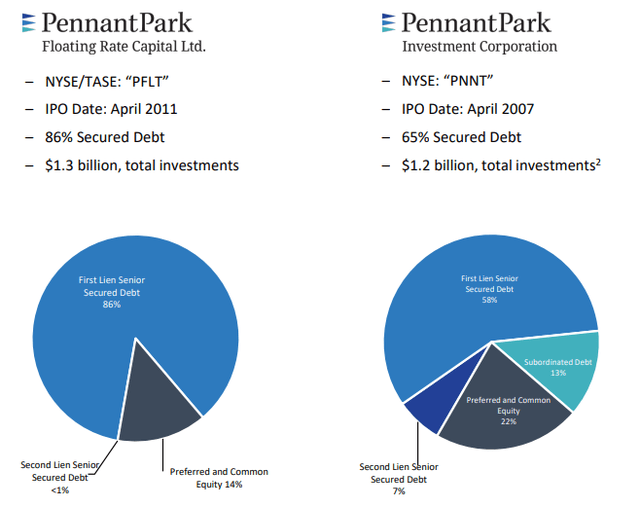
PFLT also has a diverse set of holdings in different industries. Their primarily make up of their portfolio is within the aerospace and defense, healthcare, media, software services, consumer, government services, and business service sectors. Their strategy is to avoid any investments with portfolio companies that may have asset intensive operations and require a ton of capital expenditures. They also tend to avoid cyclical based marketed that may have volatility linked to specific commodities.
PFLT has 141 different companies as part of their debt investment portfolio, and the average investment size is only $9M. Through this investment portfolio, we can see that the value has increased year over year alongside the net assets. The debt to equity ratio increased to 1.03x, but this was offset by the increase in investment purchases, up to $303M for the quarter.
PFLT Q1 Presentation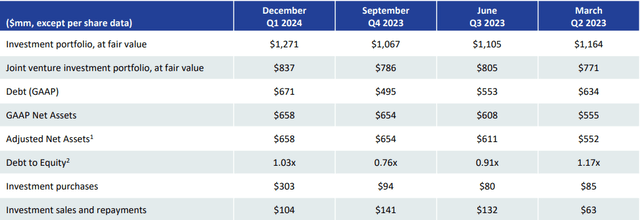
The Q1 earnings were reported in early February and the next Q2 earnings date is scheduled to be announced on May 8th, 2024. Taking a look at their Q1 earnings, we can see that NII (net investment income) was reported at $0.33 per share. In addition, NAV increased by a slight 0.6% which can be attributed to positive valuation adjustments on debt and equity investments. PFLT’ strategy is to continue fueling growth from these middle companies.
I think a focus on middle market companies is a highly efficient strategy since it offers a high yield with a lower amount of risk involved. This is likely due to the fact that middle market companies typically have less leverage and also a better interest coverage ratio. These middle market companies, ranging from EBITDAs between $10 – $50M, are also more scrutinized when it comes to due diligence, with the average research process taking 6 – 8 weeks before concluding a portfolio company may be worth the investment. In comparison, the process for a larger upper middle market company is typically a lot less detailed and quicker to complete, at 2 weeks or less.
PFLT has equity capital totaling $658M. PFLT current has $837M worth of assets, but they have a goal to reach a total of $1B. As a result, we’ve seen some growth taking place within the portfolio with new investments. Over the last quarter, PFLT invested a total of $303M into 13 new and 34 existing portfolio companies. These new investments netted to an average weighted yield of 11.9%.
Risk Profile
PFLT has been well managed in terms of capital allocation. The fund currently has a 4.8x debt to EBITDA ratio and a 2.1x interest coverage ratio. They have done an excellent job managing risk and assessing what portfolio companies they include as part of their investments. This is reinforced by the fact that only a single portfolio company sits at non-accrual status, out of their portfolio of 141 different investments.
This represents a non-accrual rate of only 0.7%! This is ultra-safe and has a lower non-accrual rating than some of the most popular BDCs out there. This means the risk profile is quite low in terms of NII and income being affected by the poor performance due to portfolio companies. For comparison, here are the non-accrual rates for some peer BDCs.
- Crescent Capital (CCAP): 2% non-accrual rate.
- Ares Capital (ARCC): 1.3% non-accrual rate
- FS KKR (FSK): 8.9% non-accrual rate.
PFLT Q1 Presentation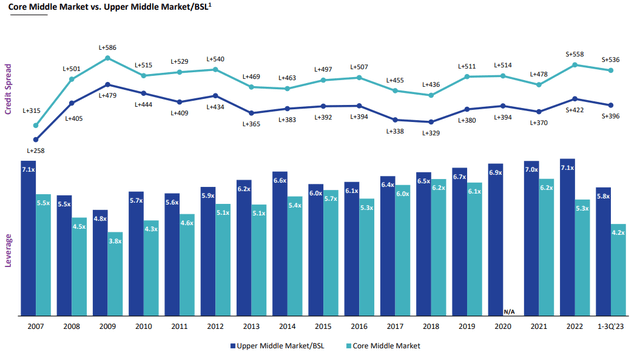
In addition, I think it’s worth pointing out that PFLT is a bit less risky than its brother fund, PNNT. This is due to the middle market focus that typically uses less leverage. As you can see, the leverage ratios are lower across the board, dating back to 2007. In addition, the credit spreads between middle market and upper middle market companies are typically different. We can see that middle market companies typically have higher credit spreads, which means that the yield produced from the investments is greater than the cost of borrowing.
Valuation
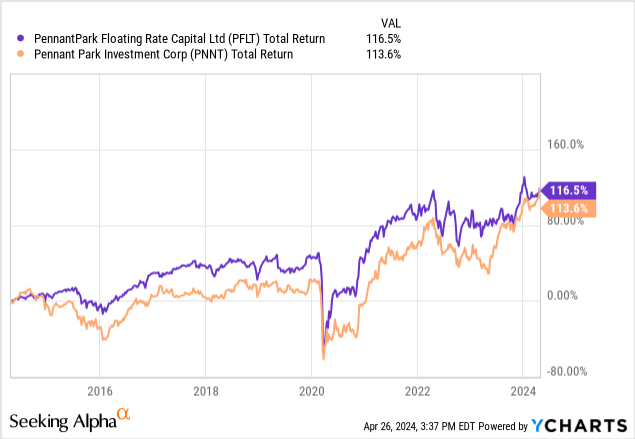
With the exception of the 2020 drop, the price range has stayed extremely consistent since inception. Dating back to 2011, the price range has consistently traded between the $10 – $14 per share marks. This price range has stayed highly consistent, no matter how well the economy is doing, where interest rates are, or what the S&P 500 movement looks like. This consistency gives us a decent idea of what makes a good entry and what doesn’t. With that being said, the price currently sits around $11.50, making it an attractive time for entry in my opinion.
CEF Data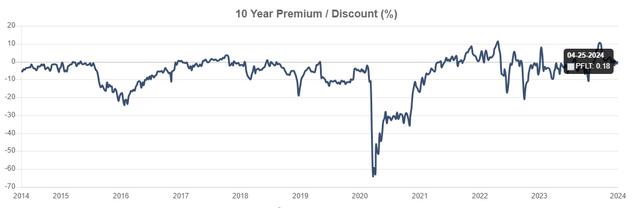
Taking a look at the price relationship to the NAV (net asset value), we can see that the price almost near fair value, with a tiny premium to NAV of 0.18%. Over the last 3-year period, the price has traded at an average discount to NAV of -0.74%. For simplicity sake, let’s just say that trading near par with the NAV represents fair value, where the premium and discount are both 0%. Therefore, I believe that entry here would be ideal if you wanted to start a long-term position to capture some income from higher rates.
However, it would be fair to point out that between 2014 and 2020, the price more frequently traded at a discount to NAV than it did at a premium. While this means, that PFLT’s true fair value may possibly lean closer towards discount value, I also want to take into consideration that the economic and interest environment back then was totally different than it is now.
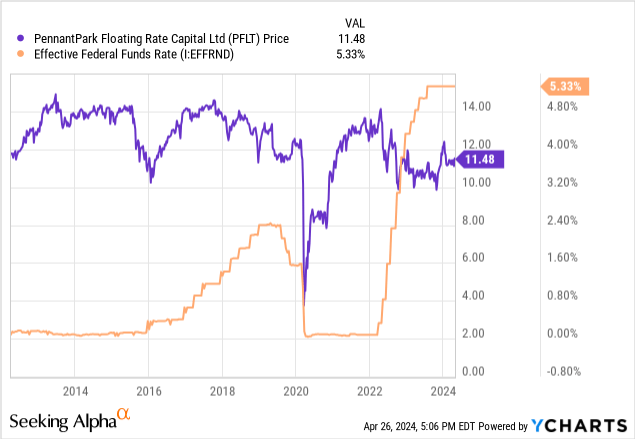
If we go back and look at how the price of PFLT moved in relation to the federal funds rate, we can see that the two correlate a lot less than expected. PFLT still managed to remain in the same price range, no matter what was happening with rates. We do see some slight reaction to interest rate change in 2016, for example, where the rate was increased, and the price took a sharp retraction before climbing back up. Similarly, 2020s price aligned with the rate cuts near zero.
Once rates started to rapidly rise in 2022, we saw the price start to dip as well. Therefore, we can conclude that PFLT has a bit of sensitivity to rate fluctuations, so if you believe that rates may be cut in the future, you may be able to get in at a more attractive price point. However, if your main priority here is income, then I believe this makes for a solid entry price.
Dividends
What makes PFLT a great choice for income investors is that the dividend payments are issued out on a monthly basis. As of the latest declared monthly dividend of $0.1025 per share, the current dividend yield sits in the double digits at 10.7%. While the dividend growth is a bit lackluster, I don’t count this as a knock against PFLT. For a fund that aims to adapt to floating rates, the distributions have actually been quite consistent throughout all environment. In fact, it looks like the distribution was never cut, even in the 2020s market drop.
However, I would love to see a higher margin of cushion between the NII and the distribution. As noted, the distribution sits at $0.1025 on a monthly basis, which translates to $0.3075 on a quarterly basis. The NII that was reported in Q1 was $0.33 per share. This means that the dividend distribution is covered by 107% based on NII. While I am certainly happy that it’s fully covered, a larger margin of safety would be reassuring if rates are cut in the future and NII decreases.
The distribution has steadily grown from the starting payout of $0.05 per share in 2011, up to the current payout of $0.1025. I ran a back test of the dividend income growth with Portfolio Visualizer. The assumption is based off an original investment of $10,000 at inception. No additional capital was deployed, and dividends were reinvested each month. In 2011, your dividend income would have been $956. Fast-forward a decade, and we can see that your income would have now grown to $3,340 while your position size would now be worth nearly $35,000.
Portfolio Visualizer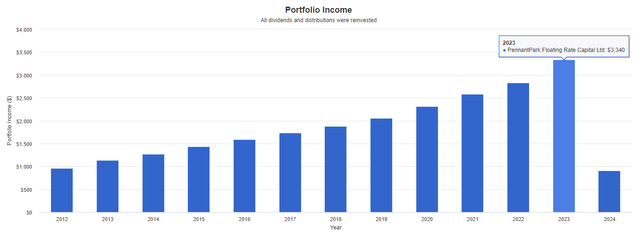
In comparison, PNNT raised the dividend a lot more often throughout the interest rate rises. As a result, it looks a lot more enticing at first, and there’s certainly a crowd that would love these kinds of raises. However, the raise from PNNT follows a reduction of 33% back in 2020 when the markets dropped. PFLT managed to maintain the distribution, which makes it a lot more attractive in my eyes in terms of reliability and stability. I imagine that income focused investors who are nearing or at retirement would also share this view. PFLT is better suited for income-based investors that depend on the income produced from their portfolio.
Takeaway
PennantPark Floating Rate Capital is a much more stable choice over PNNT. The dividend may not grow at the rate of PNNT, but it also held up a lot better in 2020 by avoiding a cut. The steady price range makes it a bit easier to gauge where fair value lies. Despite the price trading at a tiny premium to NAV, I believe PFLT presents a great opportunity to capture consistent monthly dividend income. The portfolio has proven to be high quality, with a non-accrual rate of only 0.7%. Therefore, I rate PFLT a Buy.
Credit: Source link


