
• bitcoinBitcoin(BTC)$85,452.00-0.58%
  • ethereumEthereum(ETH)$2,721.75-1.04%
  • tetherTether(USDT)$1.000.00%
  • binancecoinBNB(BNB)$779.64-0.93%
  • rippleXRP(XRP)$1.571.77%
  • usd-coinUSDC(USDC)$1.000.00%
  • solanaSolana(SOL)$116.91-0.34%
  • tronTRON(TRX)$0.341716-1.24%
  • zcashZcash(ZEC)$1,635.066.80%
  • Figure HelocFigure Heloc(FIGR_HELOC)$1.031.75%
  • HyperliquidHyperliquid(HYPE)$94.90-0.86%
  • dogecoinDogecoin(DOGE)$0.0995520.77%
  • moneroMonero(XMR)$565.82-2.06%
  • whitebitWhiteBIT Coin(WBT)$85.83-0.74%
  • USDSUSDS(USDS)$1.00-0.01%
  • chainlinkChainlink(LINK)$12.73-1.72%
  • cardanoCardano(ADA)$0.2501731.11%
  • RainRain(RAIN)$0.012824-4.91%
  • leo-tokenLEO Token(LEO)$8.98-0.03%
  • stellarStellar(XLM)$0.2131711.00%
  • bitcoin-cashBitcoin Cash(BCH)$349.5518.59%
  • nearNEAR Protocol(NEAR)$4.742.71%
  • uniswapUniswap(UNI)$9.694.81%
  • Ethena USDeEthena USDe(USDE)$1.000.01%
  • litecoinLitecoin(LTC)$62.182.51%
  • avalanche-2Avalanche(AVAX)$10.75-0.57%
  • daiDai(DAI)$1.00-0.01%
  • CantonCanton(CC)$0.112374-5.98%
  • USD1USD1(USD1)$1.000.00%
  • hedera-hashgraphHedera(HBAR)$0.094809-0.13%
  • suiSui(SUI)$1.01-0.43%
  • the-open-networkGram (prev. Toncoin)(GRAM)$1.441.07%
  • shiba-inuShiba Inu(SHIB)$0.000006-0.12%
  • BittensorBittensor(TAO)$309.20-3.39%
  • Global DollarGlobal Dollar(USDG)$1.00-0.01%
  • crypto-com-chainCronos(CRO)$0.065379-1.44%
  • MemeCoreMemeCore(M)$1.27-3.75%
  • paypal-usdPayPal USD(PYUSD)$1.000.00%
  • tether-goldTether Gold(XAUT)$4,305.90-0.66%
  • BitwayBitway(BTW)$0.959.84%
  • okbOKB(OKB)$121.44-0.64%
  • Circle USYCCircle USYC(USYC)$1.140.01%
  • Ripple USDRipple USD(RLUSD)$1.00-0.01%
  • BlackRock USD Institutional Digital Liquidity FundBlackRock USD Institutional Digital Liquidity Fund(BUIDL)$1.000.00%
  • aaveAave(AAVE)$146.922.48%
  • Ondo US Dollar YieldOndo US Dollar Yield(USDY)$1.140.10%
  • mantleMantle(MNT)$0.682.31%
  • EthenaEthena(ENA)$0.2135191.32%
  • OndoOndo(ONDO)$0.4312090.26%
  • pepePepe(PEPE)$0.000005-2.66%
TradePoint.io
  • Main
  • AI & Technology
  • Stock Charts
  • Market & News
  • Business
  • Finance Tips
  • Trade Tube
  • Blog
  • Shop
No Result
View All Result
TradePoint.io
No Result
View All Result

Patient Capital Management Q4 2025 Commentary

January 18, 2026
in Market & News
Reading Time: 11 mins read
A A
Patient Capital Management Q4 2025 Commentary
ShareShareShareShareShare

PM Images/DigitalVision via Getty Images

The More Things Change, The More They Stay The Same

Samantha McLemore

Feedback is a gift. Giving advice isn’t easy. Neither is self-improvement. I try to incorporate feedback from anyone I trust. Unfortunately, I’ve fallen short on some of Bill Miller’s sage wisdom: short letters. This time, I’m committed!

It should be easier than usual because our investment views haven’t changed. We believe we’re in the later stages of a secular bull market that began in March 2009. The latest stage has historically brought some of the strongest returns. Longer term prospects may be more muted.

The S&P 500 delivered a handsome 17.7% return in 2025, following two 25% or more years in 2023 and 2024. The Patient Opportunity Equity Strategy performed strongly, up 26.1%, 840 basis points ahead of the benchmark. It’s our second best 3-year performance on record, compounding at 29.5% vs. S&P 500’s 23.0%. Our mutual fund managed in the same strategy has been at the top of its Mid Cap Value category for three consecutive years.

It was a tough year for active management overall, with 73% of equity mutual funds trailing their benchmarks, the fourth most since 2007. I attribute our success to a combination of skill and luck – usually the case in investing. I have deep conviction in our exemplary investment process, with a focus on investments whose prices do not reflect underlying fundamental intrinsic values. This approach has withstood the test of time, starting over four decades ago by Bill Miller and continuously refined since then.

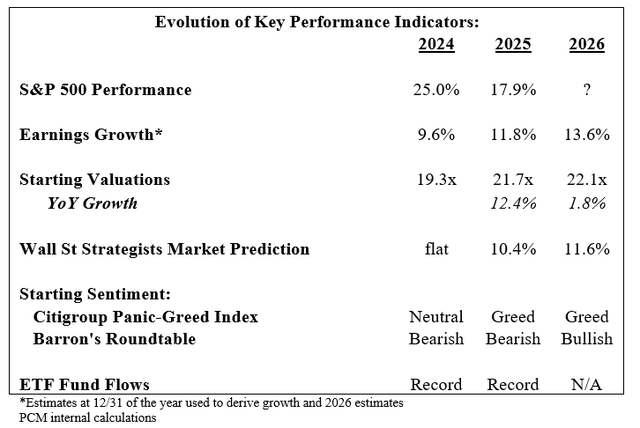
Three years ago, markets discounted a recession. Pessimism proliferated. Wall Street strategists even predicted a down market in 2023. Juicy bargains were everywhere. We salivated over the sizeable disconnects between fundamental business values and market prices. Low expectations create great starting points.

Economic growth continued and inflation normalized. The economy remains solid, despite some labor market softening. The Fed appears poised to continue cutting rates. Five-year inflation breakevens ended 2025 (2.2%) near its annual low. Fiscal stimulus will pick up in 2026 as the One Big Beautiful Bill kicks in.

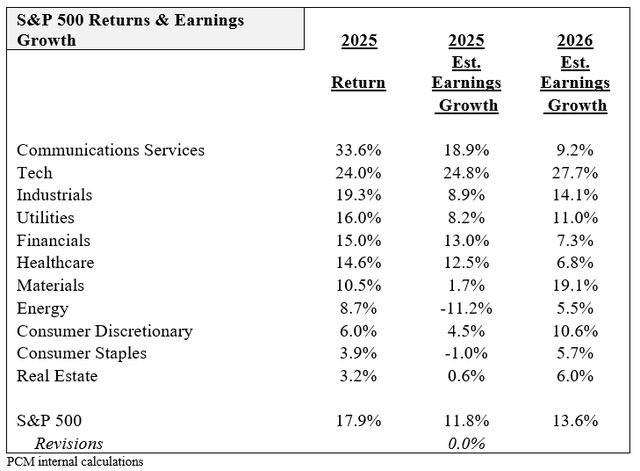
Corporate earnings’ growth has been much stronger than expected, up 9.6% in 2024 and 11.8% in 2025. In the first three quarters of last year, earnings’ growth surpassed consensus expectations by an average of 6 percentage points. Tech (+25%) and Communications Services (+19%) drove most of the growth, with healthcare and financials also up double digits.

No wonder markets have been so strong. Consensus calls for growth to accelerate to 13.6% in 2026, a tougher bogey to beat. If corporations do that well, markets should be strong.

Expectations have followed prices higher. Market strategists now expect double-digit returns in 2026, as they did in 2025. The Citigroup Fear-Greed Index registers greed, like the start of last year. Valuations, with the S&P 500 at 22x 2026 earnings, are at the high end of their historical range. Even Barron’s Roundtable turned bullish on US equities for the first time in years.

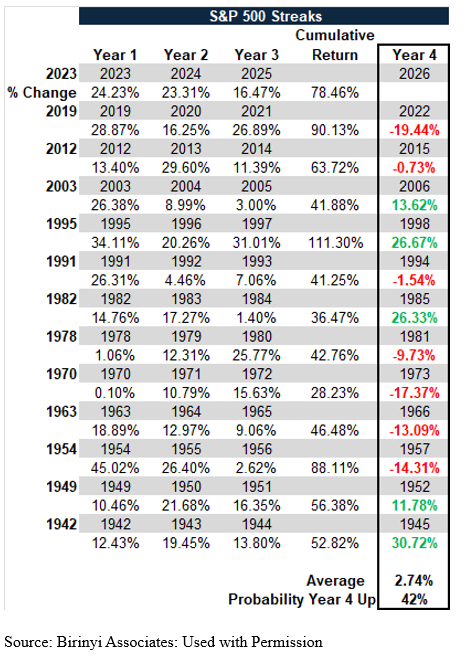
Higher expectations create risk. According to Birinyi, after three consecutive up years, the odds of the S&P 500 rising for a fourth year are worse than a coin-toss, at 42%. Much worse than the 70% base rate for all years. The up years, however, had significant gains, with an average return of +11%. (see chart in Appendix)

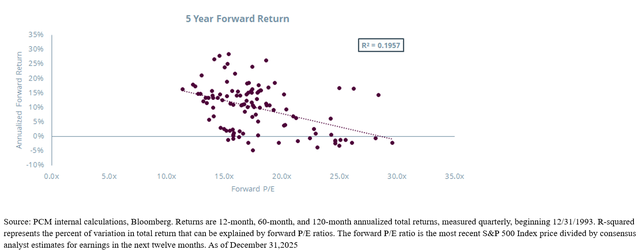
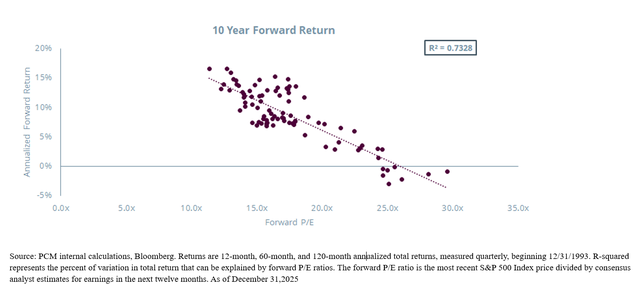
We see the late 90’s as the most comparable period given the technological revolution (AI now, the Internet then). The fourth consecutive up year of that period, 1998, accompanied a 26.7% market advance. The forward five-year returns, however, were negative, but only slightly so (despite an ending point near the bottom of the bear market). The ten-year returns? Just shy of 6% per year.

The range of future outcomes is, as always, wide. Negative 5-year equity returns are unusual, and typically only occur during significant bear markets. This is not our base case.

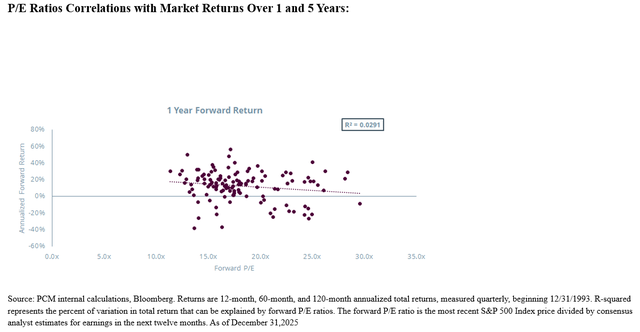
Elevated valuations imply lower future returns. Their explanatory power grows with time, from 3% correlation over a 1-year horizon, to 20% over 5-years, and 73% over 10 years. When valuations cause market problems, though, value managers have historically benefited.

Much depends on corporate earnings growth. In our analysis, if it continues to be double digits, with valuations rising back to historical peaks, markets will continue delivering above average double-digit returns.

At stable multiples, if earnings grow at the rate we saw in the late 90’s, 9.1%, the market would return 8.9%. If earnings growth is closer to the long-term average of 6.6%, stable multiples would imply a market return closer to 6.4%. Interestingly, T Rowe Price’s (TROW) bottoms up market IRR (internal rate of return) forecast model yields an estimated 6.8% 5-year forward return.

AI and technology will be integral to what happens. Nvidia (NVDA $183.14) represents 20% of the index’s estimated 2026 growth, while over 40% depends on Nvidia plus Microsoft (MSFT $459.38), Broadcom (AVGO $339.89), Apple (AAPL $259.96), Meta ((META) $615.52), Amazon (AMZN $236.65) and Micron (MU $333.35). So far, technology prospects remain strong, while skepticism prevails. Let’s hope AI bubble mania continues.

The truth is no one knows what the future has in store. Bold claims typically yield false predictions. As William Butler Yeats said, “The best lack all conviction, while the worst are full of passionate intensity.”

We account for the full range of future possibilities when constructing portfolios. We aim for solid odds of outperforming in the worst case, and the best – a tall task! There are two sources of risk and return: earnings/cash flow (fundamentals) and valuations (expectations). When both are depressed, playing aggressive offense makes sense.

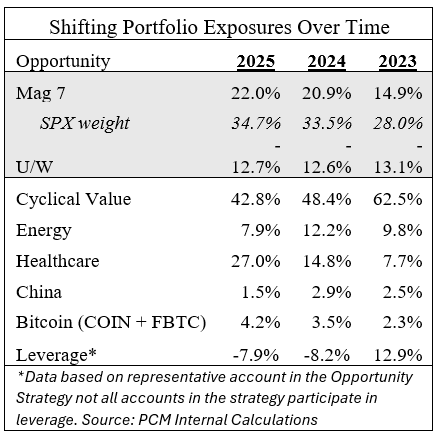
As values normalize, you’re paid less to take risk. As such, we’ve pared back exposures. We’ve monetized volatility by paring back names closer to intrinsic value and adding to those with better risk reward. Our cyclicals weight continues to decline, along with our leverage. We built a significant stake in healthcare, which reached 50-year relative valuation lows during the year. With less economic earnings sensitivity and low valuations, healthcare should increase the portfolio’s resilience.

Our primary work consists of doing the bottom-up analysis of companies’ prospects, comparing those to market prices, and positioning the portfolio for strong returns. Being contrarian and long term, the opposite of how most behave, helps our opportunity set.

We are still finding bargains, but nowhere near what existed a few years ago. We internally calculate strategy upside of 62%, still attractive, though it’s declined over the past few years. We believe the portfolio can compound in the low double-digit rates, which should nicely outperform the market.

We believe Amazon should have a great year, after underperforming in 2025. QXO (QXO $25.52) seems set for another deal soon, which will accelerate its progress in constructing a $50B building products company. Citigroup’s (C $112.41) turnaround continues with additional upside. UnitedHealthcare’s (UNH $334.96) improvements should escalate this year. Royalty Pharma (RPRX $40.21) and Norwegian Cruise Lines (NCLH $23.09) remain favorites. We’ve also added to Coinbase (COIN $255.86) and Crocs (CROX $83.54), which we think are particularly attractive in here. Our top ten names represent about half the portfolio, while the top twenty are around 80%.

We concentrate the portfolio in our highest conviction names. Given high uncertainty about the future, we like a longer tail of diversified exposures which helps the portfolio do well in a variety of scenarios.

There are many other attractive names in the portfolio, but I can’t address them all. What I can say is we are obsessively focused on ensuring the portfolio is well positioned for all environments.

I’ve included some supporting tables and charts in the appendix. Thanks for your continued support and please reach out if we can help.
Appendix:

KPI 4Q25

sp500 growth 4q25sp streak 4q25PE 4q25 New5 year new new10 year new new

YOU MAY ALSO LIKE

Hundreds missing in Nepal after massive flash flood

Meta agrees to pay $18 billion to settle social media addiction lawsuit

port exposure new new

FOR INSTITUTIONAL INVESTORS ONLY

Security prices referenced are as of 1/14/26

The reference to the strategy’s upside is calculated as of 1/12/26. This is an internal estimate of the Portfolio Upside to Central Tendency of Value (CTV) and is a proprietary calculation based on our assessment of the intrinsic value of individual company holdings currently in the portfolio. Portfolio Upside to CTV refers to the weighted average expected return from each individual company reaching our estimate of intrinsic value from its current trading price. CTV is a probability-weighted estimate of what we believe is the intrinsic value per share for each individual company currently in the portfolio. As part of this process, we build detailed, long-term company models for a variety of scenarios and use multiple valuation methods, such as discounted cash flow (DCF), comparable company analysis, private market analysis, historicals, liquidation, and LBO analysis. These different valuation methodologies are probability weighted to create our CTV. The analysis embeds both risk and return features and allows comparison across securities. Upside to CTV refers to the expected return from a stock reaching our estimate of intrinsic value from its current trading price.

The views expressed in this commentary reflect those of Patient Capital Management portfolio managers and analysts as of the date of the commentary. Any views are subject to change at any time based on market or other conditions, and Patient Capital Management disclaims any responsibility to update such views. These views are not intended to be a forecast of future events, a guarantee of future results or investment advice. Because investment decisions are based on numerous factors, these views may not be relied upon as an indication of trading intent on behalf of any portfolio. Any data cited herein is from sources believed to be reliable but is not guaranteed as to accuracy or completeness.

The information presented should not be considered a recommendation to purchase or sell any security and should not be relied upon as investment advice. It should not be assumed that any purchase or sale decisions will be profitable or will equal the performance of any security mentioned. References to specific securities are for illustrative purposes only. Portfolio composition is shown as of a point in time and is subject to change without notice.

All historical financial information is unaudited and shall not be construed as a representation or warranty by us. References to indices and their respective performance data are not intended to imply that the Strategy’s objectives, strategies or investments were comparable to those of the indices in technique, composition or element of risk nor are they intended to imply that the fees or expense structures relating to the Strategy or its affiliates, were comparable to those of the indices; since the indices are unmanaged and cannot be invested in directly.

Portfolio holdings and portfolio discussion are for a representative Opportunity Equity account. Holdings discussed may or may not be included in all portfolios subject to account guidelines. Returns for periods greater than one year are annualized.

Any third party links, trademarks, service markets, logos and trade names included in the report are property of their respective owners. The inclusion of third party link is provided for reference and does not imply endorsement or, association with the site or party by us.

The performance information depicted herein is not indicative of future results. There can be no assurance that Opportunity Equity’s investment objectives will be achieved and a return realized.

Investors should carefully review and consider the additional disclosures, investor notices, and other information contained elsewhere in this document as well as the Offering Documents prior to making a decision to invest.

Click for the Patient Opportunity Equity Strategy Composite Performance Disclosure: GIPS Composite Disclosure

QTD YTD 1-Year 3-Year 5-Year 10-Year Since Inception (12/30/1999)
Opportunity Equity (gross of fees) 6.2% 27.3% 27.3% 30.8% 6.9% 11.9% 9.3%
Opportunity Equity (net of fees) 6.0% 26.0% 26.0% 29.5% 5.9% 10.8% 8.2%
S&P 500 Index 2.7% 17.9% 17.9% 23.0% 14.4% 14.8% 8.1%

Past performance is no guarantee of future results.

©2026 Patient Capital Management, LLC

Original Post

Editor’s Note: The summary bullets for this article were chosen by Seeking Alpha editors.

Credit: Source link

ShareTweetSendSharePin

Related Posts

Hundreds missing in Nepal after massive flash flood
Market & News

Hundreds missing in Nepal after massive flash flood

September 23, 2026
Meta agrees to pay  billion to settle social media addiction lawsuit
Market & News

Meta agrees to pay $18 billion to settle social media addiction lawsuit

September 23, 2026
Drone footage shows destruction left after flash flooding in Nepal
Market & News

Drone footage shows destruction left after flash flooding in Nepal

September 23, 2026
JEPQ: Hedging AI Infrastructure Growth With Monthly Cash Flow (NASDAQ:JEPQ)
Market & News

JEPQ: Hedging AI Infrastructure Growth With Monthly Cash Flow (NASDAQ:JEPQ)

September 23, 2026
Next Post
Video appears to show missing teen Camila Mendoza Olmos

Video appears to show missing teen Camila Mendoza Olmos

Leave a Reply Cancel reply

Your email address will not be published. Required fields are marked *

Search

No Result
View All Result
Federal judge orders DHS to pause construction of border wall in Big Bend National Park

Federal judge orders DHS to pause construction of border wall in Big Bend National Park

September 21, 2026
Three Steps to Hedging a Portfolio With Futures

Three Steps to Hedging a Portfolio With Futures

September 16, 2026
Mamdani announces ban on AI for young students in NYC public schools

Mamdani announces ban on AI for young students in NYC public schools

September 19, 2026

About

Learn more

Our Services

Legal

Privacy Policy

Terms of Use

Bloggers

Learn more

Article Links

Contact

Advertise

Ask us anything

©2020- TradePoint.io - All rights reserved!

Tradepoint.io, being just a publishing and technology platform, is not a registered broker-dealer or investment adviser. So we do not provide investment advice. Rather, brokerage services are provided to clients of Tradepoint.io by independent SEC-registered broker-dealers and members of FINRA/SIPC. Every form of investing carries some risk and past performance is not a guarantee of future results. “Tradepoint.io“, “Instant Investing” and “My Trading Tools” are registered trademarks of Apperbuild, LLC.

This website is operated by Apperbuild, LLC. We have no link to any brokerage firm and we do not provide investment advice. Every information and resource we provide is solely for the education of our readers. © 2020 Apperbuild, LLC. All rights reserved.

No Result
View All Result
  • Main
  • AI & Technology
  • Stock Charts
  • Market & News
  • Business
  • Finance Tips
  • Trade Tube
  • Blog
  • Shop

© 2023 - TradePoint.io - All Rights Reserved!