
hirun
ONEOK (NYSE:OKE) is one of the largest midstream companies with a market cap of $48 billion. The core business focus of OKE is in gathering, processing, fractionating, transporting, storing and marketing natural gas and NGLs. This is consistent with the business segments of most other midstream players that have invested in multiple levers across the midstream value chain.
What is quite unique about OKE is its track-record of delivering sustained adjusted EBITDA growth over the past 10 years, which includes periods of oil price collapse and COVID-19. For example, the annual adjusted EBITDA growth rate from 2013 to 2023 is just over 15% with the guidance for 2024 of 18%.
However, if we isolate the last three years and compare how OKE has performed relative to the broader MLP (or midstream) market, we will notice an almost perfect correlation in the total return dynamics.
Ycharts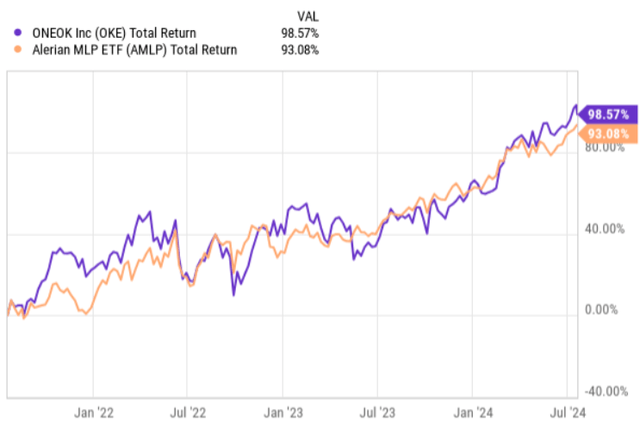
Now, the question is whether OKE has the right fundamentals to maintain this trend or even start generating alpha over the MLP index. This is very important to answer given the following two aspects:
- The current FWD yield of OKE stands at 4.7%, which is clearly below the sector average and what could be find in other investment grade and highly diversified midstream players.
- The valuation multiple for OKE is currently on the aggressive side, which in combination with a relatively unattractive dividend yield creates a pressure for OKE to record significant growth levels in the adjusted EBITDA.
Below, I will just illustrate some selected yield and multiple differences between OKE and other investment grade and defensive midstream companies:
- MPLX LP (NYSE:MPLX) – forward (“FWD”) EV/EBITDA of 9.9x and a dividend yield of 7.9%.
- TC Energy (NYSE:TRP) (TSX:TRP:CA) – FWD EV/EBITDA of 11.4x and a dividend yield of 6.8%.
- Energy Transfer (NYSE:ET) – FWD EV/EBITDA of 7.9x and a dividend yield of 7.7%.
- Enterprise Products Partners (NYSE:EPD) – FWD EV/EBITDA of 9.6x and a dividend yield of 7.0%.
OKE’s FWD EV/EBITDA is 11.4x and the FWD yield as mentioned above stands at 4.7%, which render OKE quite expensive. Here it is also important to note that the projected adjusted EBITDA growth in 2024 is already factored in the FWD EV/EBITDA multiple, which, in turn, means that OKE has to also record superior growth level in 2025 and potentially beyond.
Let’s now go through the underlying fundamentals to see whether these valuations are justified.
Thesis
From the cash generation perspective, most of the top-line avenues are based on predictable and fee-based contracts, which help mitigate the commodity risk. For example, natural gas liquids, refined products and natural gas gathering & processing segments have between 85% and 90%+ of the sales stipulated against fee-based agreements. This is one of the main reasons why OKE’s adjusted EBITDA continued to grow during the period of oil price collapse and initial quarter of the pandemic.
However, in order to grow, OKE has to allocate capital into organic growth and / or new M&A transactions. While the fee-based contracts provide some cash flow bumps each year (mostly linked to core CPI or a fixed percentage), it is not sufficient to accommodate a material growth, especially to justify the current multiple of OKE.
For this reason, OKE has outlined a capital allocation policy, which leaves some capital at the company level to fuel the growth in cash generation. The combination of dividends and share repurchases are expected to account for 75%-85% of free cash flows after covering the maintenance and growth CapEx over the next four years. The remaining chunk of capital can be directed towards either optimization of the capital structure or funding incremental M&A transactions.
Considering the communicated target leverage profile of 3.5x, we could expect that in the near-term the retained liquidity after servicing the dividend payments and conducting the share buybacks will be directed towards debt reduction activity as the current run rate net debt to EBITDA is at 3.8x.
Once OKE reaches the target level leverage profile, it would be reasonable to assume a more accelerated investment program carried out by OKE. Since management has outlined a dividend policy, which entails an annual growth of 4 – 5%, it is clear that after factoring in the effects from the buybacks (which lead to lower amounts of capital to be distributed in dividends to reach the growth target on a per share basis) and growth in adjusted EBITDA, OKE will be left with more capital to deploy in business expansion.
Here it is also important to underscore the benefits of cost synergies in 2025 that are associated with a combination of recent OKE’s acquisitions and tactical steps management takes in enhancing the business (e.g., opportunities from batching, blending and bundling). Currently, management expects to realize more than $125 million in 2025.
Finally, OKE has as almost every midstream operator out there brought down the level of organic and maintenance CapEx it invests back in the business. There are multiple reasons for this, but the main two ones are (1) significant amounts of CapEx that were put at work in pre-pandemic and in the early periods after the outbreak have now reduced the need for refurbishments as well as limited the organic growth opportunity set and (2) the preference for external growth has increased as it allows to both focus on synergy extraction and avoids the locking in of notable capital in green field projects that are subject to regulatory, construction, execution and other risks that might at the end of the day either increase the capital need or lead to significant delays.
For instance, OKE’s total 2024 capital expenditure guidance is circa $1.8 billion, which based on the 2024 adjusted EBITDA estimate leaves roughly $2.4 billion of free cash flow (after CapEx, dividends and interest) to venture into sizeable investment moves provided (provided that the capital structure is in balance).
The bottom line
All in all, OKE is in a position, where it will already this year reach its target capital structure level after which we could expect to see more ambitious investments taking place. Going forward the amount of capital that will be at OKE’s discretion for funding growth opportunities is very likely to be higher as the dividend policy is limited by 4 – 5% annual growth rate, which is clearly below OKE’s adjusted EBITDA growth level (especially after factoring in the buybacks and annual fee escalators).
With that being said, we have to also appreciate the fact that the market has already (at least to some extent) already baked in this into OKE’s multiple, which is one of the highest in the sector. This is despite that there are many cheaper midstream companies (e.g., as those that I highlighted above in the article) that carry similar or even better capital structure, have their cash flows largely neutralized from the commodity risk and enjoy ample amounts of retained FCF.
It might very likely be that OKE exceeds the growth rate of most of its peers, but if, for example, the natural gas and oil markets turn south, we will be left with an expensive stock, where the multiple will have to go down to recalibrate the growth trajectory. On top of this, by going long ONEOK, investors are locking in materially lower initial dividend yields, which according to OKE’s dividend policy subject to a mediocre annual growth of 4 – 5%.
As a result of this, I am assigning a hold rating here.
Credit: Source link