

anilakkus
Ollie’s Bargain Outlet (NASDAQ:OLLI) is America’s largest retailer of closeout merchandise and excess inventory. Their products are known by the slogan of “Good Stuff Cheap” and include items such as housewares, food, books, stationeries, and a wide assortment of other “treasure hunt” goods.
The stock is a notable, yet under-recognized, outperformer, up 32% YTD. This compares favorably to a wide assortment of similar retailers. Dollar Tree (DLTR) and Dollar General (DG), for example, are both down 6% and 36% over the same period. A similar-sized peer, Big Lots (BIG), stacks up worse. Even the larger names of The TJX Companies (TJX) and Walmart (WMT) trail behind OLLI.
Seeking Alpha – YTD Returns Of OLLI Compared To Peers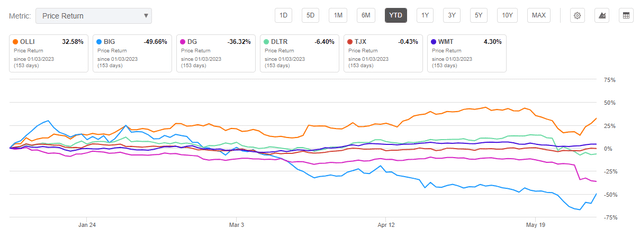
This outperformance also spans over the past one year, though TJX is the exception among the peer set.
Seeking Alpha – 1-YR Returns Of OLLI Compared To Peers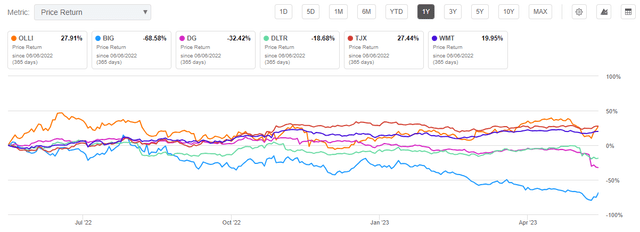
It should also be noted, however, that OLLI does lag over a more intermediate horizon. It’s down over 17%, for example, on a 5-YR timespan.
Seeking Alpha – 5-YR Returns Of OLLI Compared To Peers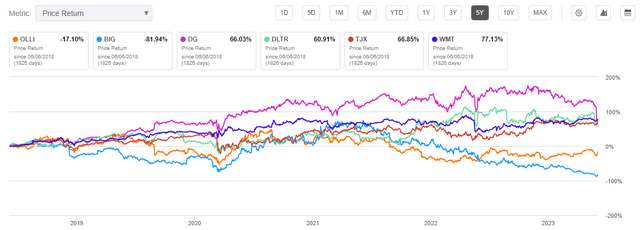
Recent outperformance, then, could be reasonably attributed to their value proposition to an increasingly stretched consumer. And their operating performance does appear to support this. In their most recently released results, the company beat expectations, provided positive commentary, and followed through with revisions higher in full-year guidance. Though the stock trades at a healthy premium, I can see positive momentum carrying shares higher to new 52-week highs following the positive beat.
OLLI Stock Key Metrics
The balance sheet is free of term debt and is comprised of a strong cash position. At the end of Q1, the company held +$135M in cash and +$140.5M in liquid short-term investments. Furthermore, they had +$91.6M available on their revolving credit facility.
In addition, their inventory balance was down 3.7% YOY due primarily to a more normalized freight environment. The improved working capital position in turn provided a positive contribution to operating cash flows, which totaled +$35.9M for the period. Capital expenditures (“CAPEX”) and repurchasing activity, however, contributed to an overall use of cash during the period of +$75.6M.
Q1FY23 Earnings Release – Summary Of Quarterly Cash Flows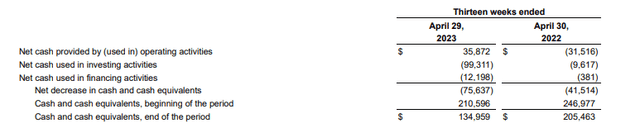
New store openings figures significantly into the company’s overall growth strategy. During the period, OLLI opened nine new stores and closed one. This brought their total store count to 476 at the end of the period. On a comparable basis, the count stood at 427. Furthermore, their stores average net sales of $970/store. This is up just under 4% from last year.
From a profitability perspective, OLLI operated on gross, operating, and adjusted EBITDA margins of 38.9%, 8.4%, and 10.8%, respectively in Q1. These metrics all perform favorably against their various competitors within both discount and big-box retail.
Seeking Alpha – Profitability Metrics Of OLLI’s Peers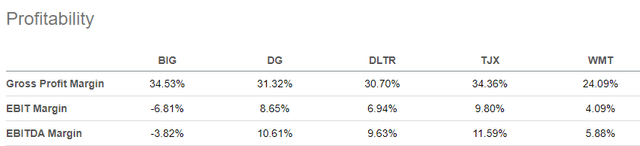
How Did OLLI’s Perform In Q1?
Results on both the top and bottom lines came in ahead of expectations. Total revenues grew 12.9%. And comparable store sales were also up 4.5% versus expectations of a 2.6% increase. The revenue growth paired with strong margins resulted in a 124.8% and 140.9% increase in operating and net income, respectively.
Improvements in margins were particularly notable. At 38.9%, gross margins were up 410 basis points (“bps”) YOY. This was due primarily to tailwinds within the supply chain. The increase would have been even greater barring lower merchandise margin relating to shrink and unfavorable product mix.
OLLI was also effective in controlling costs. Though SG&A costs were up 12% during the period, the increase was primarily attributable to their new store openings and incentive compensation. Otherwise, the rise was muted. As a percentage of net sales, SG&A was down 20bps to 28.4% YOY.
Overall, the revenue strength and margin tailwinds trickled into both operating and adjusted EBITDA margins, which were both up 420bps and 430bps, respectively.
What Is The Outlook For OLLI’s Bargain Outlet?
The expectation-beating performance in Q1 enabled positive revisions higher in full-year guidance. This is reflected most visibly in topline revenues, which are now expected to range from +$2.052B to +$2.067B. In addition, EPS is expected to settle at a midpoint of $2.61/share. This would be up about 2.8% from the $2.54/share midpoint set previously.
Q1FY23 Earnings Release – Summary Of Full-Year Guidance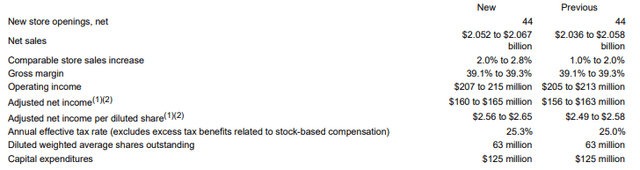
Most other line items remain in-line with prior expectations. The +$125M CAPEX target is worth additional emphasis, as it would come in higher than in years past. This is due in part to the development of their new stores, as well as to the expansion of their distribution center in York, PA and to the development of their new center in Princeton, IL.
Is OLLI Stock A Buy, Sell, Or Hold?
OLLI appears well-positioned for the current market environment. Consumers are reprioritizing their spending habits from goods to services. And for those discretionary purchases they are still choosing to make, they continue to favor the off-price model. And this model is OLLI’s specialty. Arguably, they do this better than anyone else.
And they do so on high margins. At nearly 40%, their gross margins compare favorably to both their discount peers and their more diversified big-box counterparts. Margins could be even higher, but current results showed that they, too, aren’t immune from the broader threats afflicting retailers.
This includes shrinkage and unfavorable product mix. Together, the two contributed to lower overall merchandise margins. This is perhaps one reason why the stock vacillated between gains and losses immediately following their release. This is despite a comfortable beat on expectations and positive revisions to guidance.
At just under 24x forward earnings, shares do trade at a healthy premium to other retailers within their peer set. The two publicly traded dollar giants, DG and DLTR, for example, trade at about 16x and 22x, respectively. WMT, too, trades at about 24x, and their size and scale far exceed that of OLLI. Consensus estimates on Wall Street also imply limited upside potential.
But in my view, I can see OLLI trading back up to their 52-week highs on positive momentum. This would represent an upside potential of over 15%. A strong balance sheet with a sizeable cash balance, positive repurchasing activity, and sector-leading margins could support the resulting premium. While shares may not be a bargain-basement buy, they do warrant more attention than they are currently getting.
Credit: Source link