

Yuichiro Chino/Moment via Getty Images
OFS Credit Company, Inc. (NASDAQ:OCCI) is a CEF, which invests in CLO structures that are primarily associated with equity lever. The underlying pool of these CLOs is usually comprised of U.S. senior secured loans, which are then further segmented into several tranches starting from the most senior one (e.g., investment grade space) and ending at the equity bucket (i.e., the riskiest one), where OCCI happens to exercise its investment strategy.
In terms of the market cap, OCCI is quite small with just over $122 million based on the current market price of ~ $7.14.
If we look at OCCI’s performance since the IPO back in 2018, the Fund has remained more or less flat.
Ycharts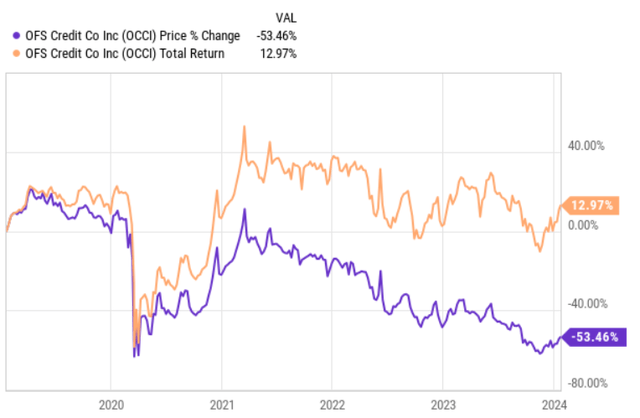
In price return terms, OCCI has actually lost almost half of its value, but factoring in dividend, the total return figure lands at ~13%. This just shows how the dividends play a significant role in the overall return generation. In other words, OCCI could be viewed as a pure-play income stock (or CEF), where investors have to be ready to experience erosion (without dividend reinvestments) in the original investment principal value.
Interestingly, a couple of weeks ago I issued an article on Oxford Lane Capital Corporation (NASDAQ:OXLC), which also carries a massive exposure to CLO equity structures. The recommendation was a hold mostly due to the inherent risk profile that is associated with unprotected CLO tranches.
Yet, the point here is that if we compare these two names, we will observe a very strong correlation in the return dynamics.
Ycharts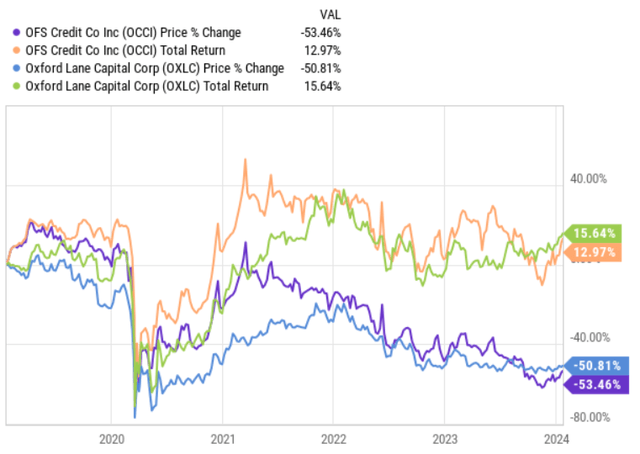
So, it is not a OCCI-specific issue, where the NAV erosion is present and the total returns somewhat flat in the past couple of years.
The question now is whether OCCI and its current dividend yield of ~17% (annualized based on January, 2024 payment) is attractive enough to motivate yield-seeking investors going long the CEF.
Thesis
As stated earlier, OCCI is heavily exposed to CLO instruments, which together (CLO debt and equity) account for roughly 96% of the total portfolio. The CLO equity component constitutes ~ 71% of the AuM with the remaining chunk (~25%) being attributable to a bit less risky CLO debt instruments.
OCCI Investor Presentation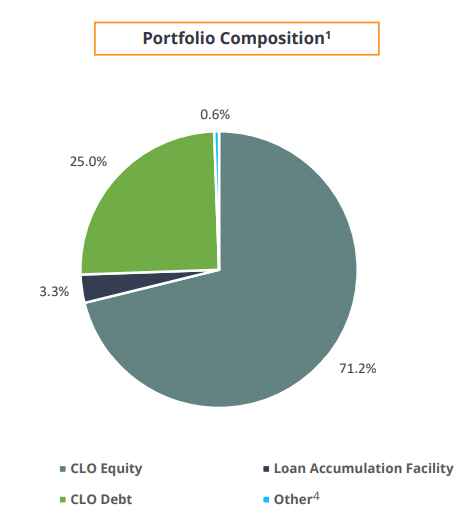
The fact that OCCI embodies such a notable exposure towards CLO equity renders the CEF a truly speculative vehicle. While CLO equity offers high double digit yield and high-return potential, all of this comes at the expense of a balanced risk profile.
Namely, as CLO equity owners are first in line to absorb any potential losses or defaults within the specific CLO structure, there is a huge sensitivity to both idiosyncratic and systematic risk factors.
OCCI Investor Presentation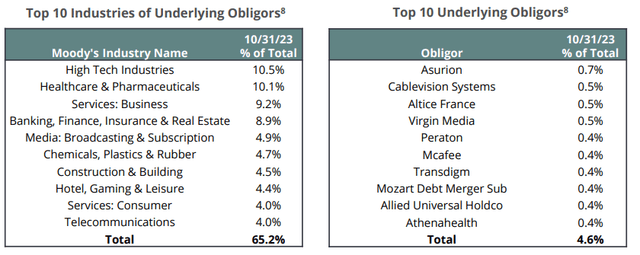
The positive nuance in this context is a combination of two factors:
- OCCI’s diversified portfolio both from the obligor and industry perspective.
- OCCI’s ~28.3% allocation into CLO debt and loan accumulation facilities, which provide a better margin of safety than a pure-play exposure to CLO equity (albeit, the risks are still there and the CLO equity component consumes the lion’s share of the NAV).
Plus, if we take a look at the current NAV dynamics, we might find an additional element of safety, where OCCI trades at a discount thereby offering investors some of the NAV base essentially for free. See below an excerpt from the recent update by OCCI:
Management’s unaudited estimate of the range of our NAV per share of our common stock as of December 31, 2023 is between $7.61 and $7.71. This estimate is not a comprehensive statement of our financial condition or results for the month ended December 31, 2023. This estimate did not undergo the Company’s typical quarter-end financial closing procedures.
Based on the current share price and the mid-range of the estimate, the implied discount lands at ~8%.
Yet, in my humble opinion, the real “show stopper” is OCCI’s exposure to subpar quality obligors, where ~99% of them carry a below investment grade balance sheets. Moreover, the bulk of obligors concentrate in B and B- categories, which mean that these CLO constituencies exhibit significant uncertainties and exposure to adverse business conditions, which, in turn, could easily lead to delayed payments and/or defaults.
OCCI Investor Presentation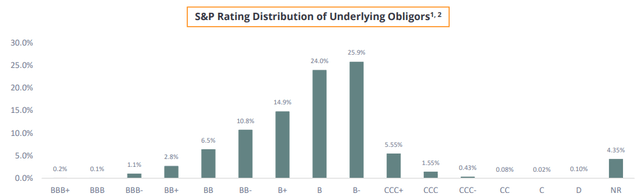
It is also worth underscoring the fact that as of now ~26% of the exposure (obligors) lie in the B- category that is just one notch away from falling into CCC+ zone. In CCC’s case companies have already become dependent on the external circumstances to maintain going concern and service the outstanding obligations.
Once again, in my views, this is a deadly combination: i.e., CLO equity bias in conjunction with an exposure to rather speculative businesses or obligors.
And if we look at the NAV erosion below (which is massive), the key explanation lies mostly in this issue (or the “deadly combination”).
Ycharts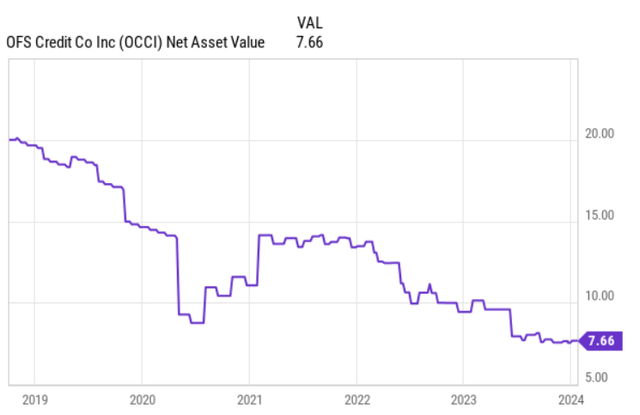
For example, the past three quarters in the net investment income per share generation have been relatively stable at $0.34 – $0.36 range, while the net loss items have together amounted to negative ~$2 per share. One of the key drivers behind these negative adjustments has been the increasing losses and write-downs stemming from defaulting obligors, where OCCI had to absorb the impact as a CLO equity tranche holder.
The bottom line
While the current yield of ~17% is quite attractive, if we contextualize this with the constant decline in NAV and historical dividend cuts, the overall investment case is far from being appealing.
There are several other elements as well, which contribute positively to OCCI’s case such as a discount to NAV and portfolio diversification, yet again, in these are not sufficient to fully justify the underlying risk that stems from the CLO equity exposure to low quality businesses / obligors, which constitute the lion’s share of OCCI’s portfolio.
At the same time I would not recommend shorting OCCI because of the inherent unpredictability of future returns that are heavily depended on the macro environment, where in case of elevated corporate distress levels, OCCI should likely plunge and, conversely, in case of steep interest rate cuts and strongly growing economy OCCI should in turn respond very well.
In my opinion, OCCI is a hold.
Credit: Source link