

BrianAJackson/iStock via Getty Images
Investment Thesis
Nationwide Nasdaq-100 Risk-Managed Income ETF (NYSEARCA:NYSEARCA:NUSI) warrants a hold rating due to its sub-optimal qualities compared to peer income funds. Compared to leading competitors, NUSI has one of the highest expense ratios and lowest dividend yields. In exchange for relatively high fees, the fund has offered relatively mediocre performance when considering capital appreciation, dividend yield, and expense ratio factors. Additionally, the fund historically has demonstrated only limited downside protection and has a relatively unattractive valuation currently due to its weight on mega-cap, big tech companies.
NUSI Overview and Compared ETFs
NUSI is an ETF that seeks to provide investors with high monthly income through an options-based strategy with holdings from the Nasdaq-100 Index. As a result, the fund advertises a fixed income quality with reduced volatility. Competing income ETFs have gained popularity in recent years by offering a high dividend yield through options, covered calls, or other complicated instruments while limiting downside. NUSI was created in 2019 and has 105 holdings with $383M in AUM.
For comparison purposes, other funds examined are S&P 500 Risk Managed Income ETF (XRMI), SPDR Blackstone High Income ETF (HYBL), and JPMorgan Equity Premium Income ETF (JEPI). XRMI owns stocks in the S&P 500 Index but achieves a risk-managed income strategy by using a net-credit collar strategy with a mix of put and call options on the same index. HYBL differs from the other ETFs in that its income generation comes from its asset allocation of more than 96% in bonds, loans, and other debt instruments. JEPI is a derivative income ETF and utilizes equity linked notes to provide a strong dividend with limited downside. JEPI, like NUSI, is heavier on IT with a 15.5% weight on information technology.
Funds Compared: Performance, Expense Ratio, and Dividend Yield
NUSI has seen a 3-year compound annual growth rate of 4.23%. The fund’s worst recent year was 2022 with a -28.26% decline, while its best year was 2023 with a 31.51% rise. XRMI has seen the worst recent performance, with an average annualized price return of -1.03% since its inception in 2021. Since HYBL’s 2022 inception, the fund has seen an average annual return of 4.3%. Finally, JEPI has seen the best annualized 3-year return of 6.98%.
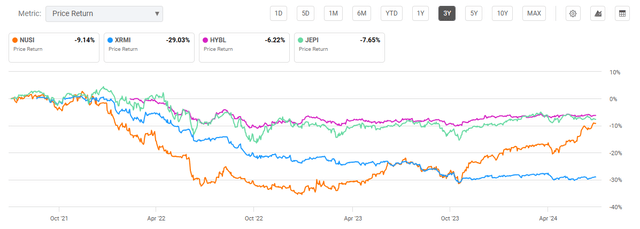
3-Year Total Price Return: NUSI and Compared Risk-Managed Funds (Seeking Alpha)
A key drawback for NUSI is its fees. At 0.68%, only HYBL has a higher expense ratio. As shown in the performance comparison earlier, investors may achieve similar price return with JEPI at a much lower 0.35% expense ratio. A primary objective for each fund is income, measured by dividend yield. These range from 6.8% to 12.2% for the compared ETFs. NUSI offers the lowest yield, which has seen a negative dividend growth CAGR over the past three years.
Expense Ratio, AUM, and Dividend Yield Comparison
|
NUSI |
XRMI |
HYBL |
JEPI |
|
|
Expense Ratio |
0.68% |
0.60% |
0.70% |
0.35% |
|
AUM |
$383.17M |
$35.66M |
$148.99M |
$33.65B |
|
Dividend Yield TTM |
6.80% |
12.19% |
8.24% |
7.35% |
|
Dividend Growth 3 YR CAGR |
-6.22% |
N/A |
N/A |
-4.54% |
Source: Seeking Alpha, 9 Jul 24
NUSI Holdings and Key Considerations
Because it tracks companies within the Nasdaq-100, NUSI is unsurprisingly heavy on information technology at 49.9% weight. NUSI’s top 10 holdings weight also stands at a relatively heavy 51.55%. With 105 holdings, NUSI is the least diversified fund compared.
Top 10 Holdings for NUSI and Peer Income ETFs
|
NUSI – 105 holdings |
XRMI – 507 holdings |
HYBL – 538 holdings |
JEPI – 131 holdings |
|
AAPL – 8.81% |
MSFT – 7.55% |
SRLN – 3.58% |
AMZN – 1.74% |
|
MSFT – 8.66% |
AAPL – 7.16% |
PARPK 2021 – 0.99% |
MSFT – 1.72% |
|
NVDA – 8.04% |
NVDA – 6.87% |
ALSN 3.75 – 0.64% |
META – 1.70% |
|
AVGO – 5.27% |
AMZN – 3.98% |
ADVGRO – 0.59% |
TT – 1.65% |
|
AMZN – 5.13% |
META – 2.53% |
DVA 4.625 – 0.57% |
PGR – 1.64% |
|
META – 4.66% |
GOOGL – 2.42% |
ALLY 6.7 – 0.57% |
GOOGL – 1.60% |
|
TSLA – 3.05% |
GOOG – 2.03% |
NUGGET – 0.54% |
INTU – 1.55% |
|
GOOGL – 2.78% |
AVGO – 1.66% |
ARES – 0.54% |
MA – 1.48% |
|
GOOG – 2.70% |
BRK.B – 1.61% |
GARDA – 0.53% |
SO – 1.46% |
|
COST – 2.52% |
LLY – 1.59% |
SUN 4.5 – 0.52% |
NOW – 1.44% |
Source: Multiple, compiled by author on 9 Jul 24
Looking forward, there are several negative outlook factors for NUSI compared to peer risk-managed income ETFs. The first factor is its overall performance when considering share price change, dividend yield, and expense ratio. As I will discuss, this overall performance has been sub-optimal compared to peers, which shows no signs of changing significantly. The second and third key factors are the fund’s ability to limit downside and maximize upside. As I will show, NUSI has not provided the same downside protection as other funds and yet has limited upside potential considering its holdings mix.
Overall Performance: All Things Considered
The first key factor that must be examined is the overall performance of NUSI when including its change in share price, dividend yield, and fees. Income funds can lure investors with an enticing dividend yield only to see depreciating returns through share price decline and high fees. Looking at NUSI, we see a 3-year share price compound annual growth rate of 4.23%. Assuming a constant dividend yield of 6.80% and expense ratio of 0.68% over the past three years for simplicity, we can then look at the fund holistically. Based on all these factors and assumptions, the real total 3-year average annual return for NUSI was 10.35%.
|
NUSI |
XRMI |
HYBL |
JEPI |
|
|
3-Year Share Price CAGR |
4.23% |
-1.03% |
4.30% |
6.98% |
|
+ Dividend Yield |
6.80% |
12.19% |
8.24% |
7.35% |
|
– Expense Ratio |
0.68% |
0.60% |
0.70% |
0.35% |
|
Total Performance |
10.35% |
10.56% |
11.84% |
13.98% |
Source: Multiple, compiled by author on 9 Jul 24
Utilizing this same methodology for the peer funds, we see that NUSI saw the lowest performance from a holistic standpoint. Although XRMI saw negative price return over the past three years, its higher dividend yield and lower expense ratio compensated for these downsides. Finally, both HYBL and JEPI saw stronger price returns and dividend yields, resulting in stronger overall performance compared to NUSI.
Risk Management Strategy
The second key factor that NUSI boasts is risk management by limiting downside potential. A key recent timeframe to measure this protection is 2022, which saw nearly a -19% drawdown in the overall market, as measured by the S&P 500 Index. By comparison, in 2022, NUSI saw a -28.26% return.
|
NUSI |
XRMI |
HYBL |
JEPI |
SPY |
|
|
2022 Share Price Change |
-28.26% |
-23.35% |
-9.30% |
-13.60% |
-18.73% |
Source: Multiple, compiled by author on 9 Jul 24
HYBL, due to its lack of equities and focus on bonds and debt instruments, saw a decline in 2022 but not as severe as the other compared funds. Much of NUSI’s decline in 2022 can be explained by its weight in the IT sector. Looking forward, the IT sector shows signs of high valuations again. Therefore, one can reasonably expect that the next tech correction will have an outsized impact on NUSI compared to peer income funds. While NUSI is less volatile than the market overall, as I will discuss later, it demonstrated the weakest ability to manage downside protection in 2022.
Limited Upside Potential
Despite NUSI’s downside potential, the fund arguably has limited upside potential given its top holdings. In 2023, NUSI saw a share price increase of 18.69%. This is surprising given that NUSI’s top 10 holdings are almost identical in selection and weight to Invesco QQQ ETF (QQQ). However, QQQ saw a return in 2023 of over 52%. Additionally, other tech-heavy funds such as Vanguard’s Information Technology Fund (VGT) and Technology Select Sector SPDR Fund (XLK) also saw massive returns in 2023.
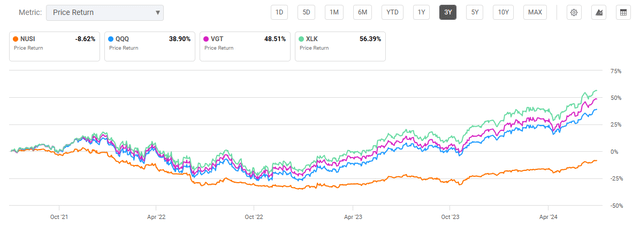
NUSI and Tech-Focused ETFs: 3 Year Total Price Return (Seeking Alpha)
Even the broader S&P 500 Index saw a better 2023 return at about 23.8%. As clearly witnessed in the figure above, NUSI does offer significantly less volatility than tech funds and the broader market. I will cover more on this when we address risks to investors.
Current Valuation
Due to strong returns for the IT sector recently, NUSI has seen a solid 20% price return over the past year. However, due to its limited upside potential previously discussed, this still lagged the market overall, as measured by the S&P 500’s 26% one-year return.
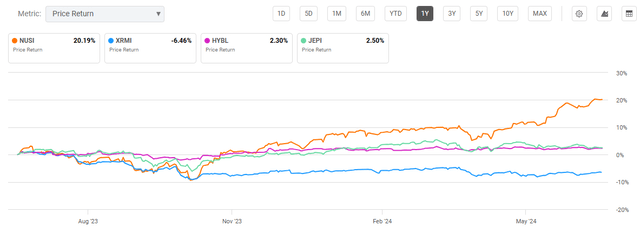
One-Year Total Price Return: NUSI and Peer Income ETFs (Seeking Alpha)
NUSI has the least desirable valuation metrics, as measured by its price/earnings and price/book multiples. HYBL’s P/E and P/B ratios are not applicable, as it predominantly consists of bonds and debt versus equities. I have written previously that mega-cap big tech companies have very high valuations currently, compared against both peers and their own averages. Therefore, I believe the IT sector is at risk of correction. As history suggests, NUSI has very limited ability to protect investors from downside.
Valuation Metrics for NUSI and Peer Competitors
|
NUSI |
XRMI |
HYBL |
JEPI |
|
|
P/E ratio |
37.07 |
22.24 |
N/A |
21.04 |
|
P/B ratio |
3.78 |
4.09 |
N/A |
4.00 |
Source: Compiled by Author from Multiple Sources, 9 Jul 24
Risks to Investors
Despite my discussion of limited upside potential, a key benefit to NUSI is that it does provide investors with lower volatility. This volatility can be measured by examining beta and standard deviation values for each fund. NUSI’s beta value stands at 0.94 indicating that it is slightly less volatile than the market overall. Additionally, the fund has a standard deviation of 14.63%, indicating less volatility than the market overall but on the higher end for a risk-managed income ETF. By comparison, JEPI, which saw the best overall performance discussed previously, has a beta value of 0.52 and a one-year standard deviation of 8.09%. This further reinforces to me that NUSI is sub-optimal in its risk management.
Concluding Summary
While NUSI offers a significant dividend yield, other income funds outperform when holistically examined including share price change, dividend yield, and expense ratio. While NUSI advertises a strategy that protects investors during declines, it is not impervious to steep drops as seen in 2022. Due to its tech-heavy focus, the fund also has a relatively high valuation compared to peers. Given high P/E ratios for several top holdings, the fund is at risk of another decline in share price. Considering its inability to significantly protect investors from corrections in the past, the fund therefore risks underperforming peer income funds. These alternatives include JPMorgan’s JEPI which has more aptly provided investors with income along with greater downside protection.
Credit: Source link