

DjelicS/E+ via Getty Images
By Levi at Elliott Wave Trader; Produced with Avi Gilburt
Now? How about now? Is it time to buy Nike (NKE) yet? We think not, and here’s why. We want to talk fundamentals first with Lyn Alden. Then we will search more into the structure of price and how we used this to project the current swoon in the stock. There’s much more here than meets the eye, so stick with this piece until the end for a fuller understanding.
The Fundamental View With Lyn Alden
Near the top in 2021, I wrote about how Nike NKE was likely overvalued. And along with Zac’s sentiment charts, the timing looked negative for it as well. I’ve occasionally commented on it since then but have had no long position because neither the fundamentals/valuation nor the sentiment/technicals were compelling.
Nike has crashed rather spectacularly since that bubble peak. Analysts now project flat-ish earnings over the next few years, and at a price/earnings ratio of around 19x, it’s still not exactly cheap for a no-growth scenario. It’s a lot more reasonably-priced now than it was back in 2021, but to be interested in the stock with conviction I’d need to see either 1) signs of a turn-around to begin justifying the current moderate valuation of 19x earnings or 2) a further price decline such that it’s reasonably-priced even for a no-growth or weak-growth scenario.
FastGraphs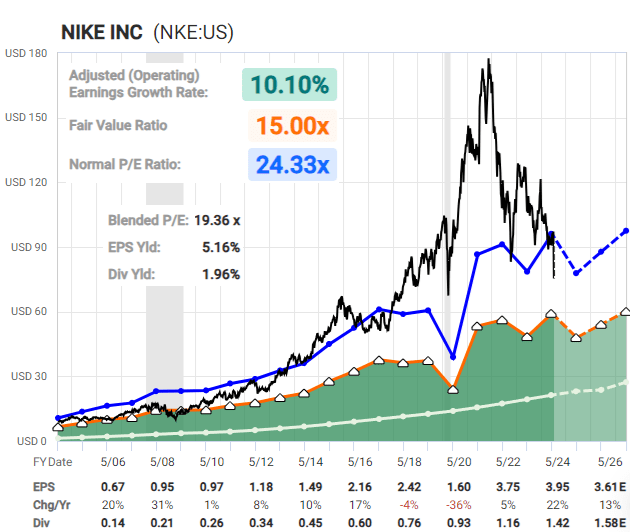
The bull case is that, in addition to their strong brand, the company has a great balance sheet with more cash-equivalents than debt, so they have plenty of resources to make the moves necessary to reignite growth.
YCharts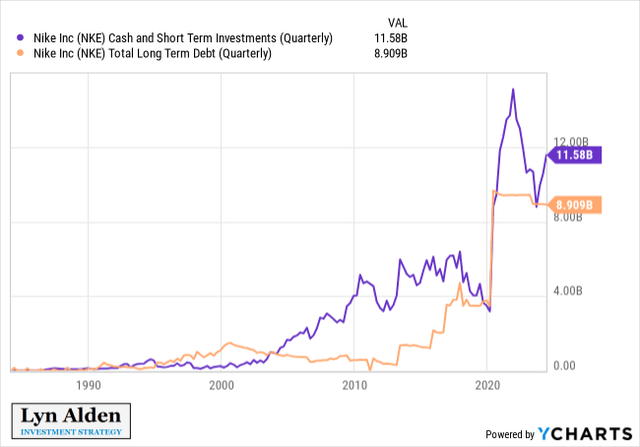
I think the stock is beginning to get ‘interesting’ at these levels, especially if an investor has a high conviction about a turnaround in growth. Personally, I’d be on the lookout for a firmer sign of a bottom or a firmer sign of a turnaround before being willing to go long with conviction.
– Lyn Alden
What Would A Compelling Setup Look Like?
Here’s exactly what we were expecting and still anticipate to take place in (NKE) stock. At the beginning of this year, we warned investors that the chart was showing a setup for a deep decline. The first article was in early January when price was near $106: “When Expectations Meet With Reality – What’s Next?”. And again in late February, this piece: “Facing Global Pressure” as the price was still hovering at the $105 level. Now, I’ll be honest, we caught some flak in the comments from that second “Sell” rating. To sum them up, some even said that the only way (NKE) would reach our $60-$62 target zone from $105 was if there was a stock split.
We don’t use this recent earnings reaction to pound our chest in victory. Nor will every single projection play out as drawn up on the charts that we share with the readership. What we will do though is post the setup and then give specific parameters that say when this invalidates or when we should shift our weight.
As we fast-forward to the present, here’s what the structure of price looks like at the moment:
Chart by Zac Mannes – StockWaves – Elliott Wave Trader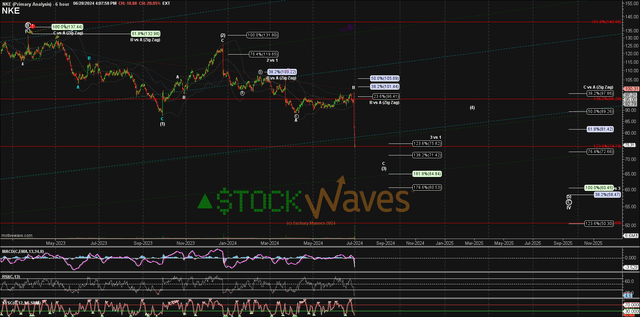
As Zac is sharing here, the typical price target for wave [3] in this setup is the $72 – $75 area. Basically, we’re there. So, for the nimble, might this present a long opportunity? Perhaps. But the larger structure really points to the $60 – $62 region for completion of the entire corrective move.
Where might this scenario need revision? You can see from the chart that once wave [3] does find a low, wave [4] should see a significant bounce. In fact, it might even overlap into where wave [1] found its low way back in the fall of 2023. To technically invalidate the sell setup as shown here with the $60 – $62 target for wave [5], price would need to move above the high struck in wave [2].
The takeaway here is that wave [3] should seek a swing low soon. Then the bounce in [4] to the $85 – $89 area before a final flounder to fulfill wave [5]. This may yet take some time. And, while we do not use Elliott Wave Theory and Fibonacci Pinball to project timing, it would fit that the next two waves, [4] and [5] should take many months to yet complete. The bounce in [4] would once again provide a potential near term short setup. We maintain our “Sell” rating on the overall chart, with an expectation for a corrective bounce due soon.
How To Make Better Decisions In Any Financial Market
This was the title of a keynote presentation given by Avi Gilburt at the recent Seeking Alpha Investing Summit. If you have not yet had the chance to view this, please feel free to do so via this link. It is well worth your time. This is the brief synopsis:
Most investors end up buying high and selling low because they are driven by news events and fear, which can lead to missed opportunities and losses. In this session, Avi Gilburt will lay out the tools needed to identify ‘market context’ (which he believes is sorely lacking in almost all analysis) and price projections which could help investors make sound, confident, and successful decisions in any market.
Why Include This With Nike?
Because (NKE) is a broadly traded stock. And, while fundamentals are important, we have found over years of observation that they do not typically lead. In fact, many times the chart will be signaling a shift in sentiment weeks or months before the fundamentals actually change.
Conclusion
There are many ways to analyze and track stocks and the market they form. Some are more consistent than others. For us, this method has proved the most reliable and keeps us on the right side of the trade much more often than not. Nothing is perfect in this world, but for those looking to open their eyes to a new universe of trading and investing, why not consider studying this further? It may just be one of the most illuminating projects you undertake.
(Housekeeping Matters)
If you would like notifications as to when our new articles are published, please hit the button at the bottom of the page to “Follow” us.
Credit: Source link