
Shutthiphong Chandaeng
Nexstar Media Overview
In January 2021, while President Biden’s victory over Donald Trump was still fresh in the minds of investors, I initiated coverage on Nexstar Media Group, Inc. (NASDAQ:NXST) and revealed an interesting statistic regarding the performance of NXST. To my surprise, I found that Nexstar stock has performed substantially better in odd years compared to even years going back to 2003. After evaluating the performance each year from 2003 to 2020, I did a simple calculation to show readers the massive divergence between the stock performance in even and odd years. Summarizing my findings, I wrote:
Let’s assume two investors used $10,000 in capital to invest in Nexstar stock. Investor 1 bought the stock on the first trading day of 2003 and liquidated his entire position on the last day of 2003. At the beginning of the next odd year (2005), he used the realized investment value at the end of 2003 to repeat this trade. This trade was repeated in every odd year thereafter.
Investor 2, on the other hand, bought the stock on the first trading day of 2004 and sold his entire stake on the last trading day of 2004. At the beginning of the next even year (2006), he used the realized investment value at the end of 2004 to repeat this trade. This trade was repeated in every even year thereafter. Illustrated below is the final value of the initial $10,000 used for this trade as of Dec. 31, 2020.
| Investor 1 | Investor 2 |
| $1,259,675 | $654.19 |
My findings, as you can observe, do not align well with the belief that Nexstar is often a big winner of political ad spending (Presidential elections fall on even years). Nexstar stock has handsomely beaten the S&P 500 (SP500) since my article (58% vs. 41%). Including dividends, Nexstar’s total return comes to almost 74% during this period. More importantly, let’s take a closer look at the annual stock performance of Nexstar since 2021 to determine whether the stock has followed its historical patterns.
| Year | Stock performance |
| 2021 | 38.27% |
| 2022 | 15.93% |
| 2023 | -10.44% |
Source: YCharts.
The outperformance in 2021 compared to 2022 can be explained by historical trends, but the strong negative return in 2023 goes against the observed long-term trend. That said, one data point should not be considered sufficient to ignore the overall long-term trend.
As an investor and analyst, I primarily focus on the fundamentals of companies. However, I often incorporate technical data (such as the performance data highlighted above) to boost my portfolio returns. An investor’s decision to invest in NXST today – or to avoid it – should be based on fundamental research, but it’s always handy to have technical data to support your thesis. After carefully considering the long-term prospects for Nexstar, I am spooked by the continued decline in linear TV, and I believe the secular decline in linear TV viewership will eventually have a major impact on the company’s profitability.
For this reason, I believe investors should book their profits and never look back. It’s important to note, however, that my investment conclusion is because I am a growth investor looking for multibagger opportunities.
Nexstar’s Distribution Revenue Growth Is Impressive
Amid the secular decline of advertising revenue, Nexstar shifted its focus to its distribution business a few years ago, which is proving to be a genius move. In Q1, distribution revenue hit an all-time high of $761 million, growing 4.5% YoY. Meanwhile, advertising revenue declined by 1% YoY to $512 million. Interestingly, distribution revenue accounted for almost 60% of total revenue, which highlights the growing importance of this segment at a time when advertising revenue continues to decline.
Exhibit 1: Q1 financial summary
Company filings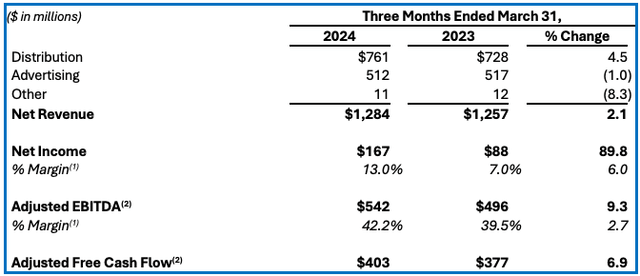
If you are not familiar with Nexstar, distribution revenue includes retransmission revenue, carriage fees, affiliation fees, and spectrum leasing revenue, according to company filings. Q1 growth in this segment was primarily driven by contract renewals on favorable terms. Below is an excerpt from the company’s Q1 press release.
Distribution revenue growth was primarily due to distribution contract renewals in 2023 on terms favorable to the Company, annual rate escalators, and the return of our partner stations on one MVPD in January, partially offset by MVPD subscriber attrition.
When it comes to virtual MVPDs, Nexstar is expanding its reach on popular platforms such as YouTube TV. During the Q1 earnings call, the management highlighted the addition of 12 new CW affiliations to the station group as well, which has also helped drive distribution growth.
In addition to this, to mitigate the impact of the declining advertising business, Nexstar has resorted to diversifying into digital platforms as well. This is a good sign.
Despite The Improvements, NXST’s Growth Will Be Lackluster
The distribution business is performing well, but for three main reasons, I believe overall long-term growth will be lackluster at best.
First, retransmission revenue, which is a major component of the distribution segment, will grow at a slower pace compared to the historical averages in the coming years. According to the management, retransmission revenue will grow at mid-single-digits in 2024 compared to the low-double-digit growth that we have seen recently. This deceleration does not come as a surprise, given the shrinking user base of linear TV. The expectations of the management align well with S&P Global’s findings. Below is an excerpt from a recent report published by S&P Global.
Kagan expects single-digit percentage growth for retransmission consent fees in the next few years amid the contracting linear TV market. With slower retrans revenue growth, broadcasters face more pressure to produce growth in the industry’s other major revenue category: advertising.
Unlike the decline in advertising revenue, retransmission revenue growth deceleration may take some time to be reflected on Nexstar’s financial statements as revenue per subscriber may continue to increase in the foreseeable future because of the multi-year contracts signed by the company with pay-TV providers which enables the company to increase fees due to built-in rate-change agreements. Eventually, though, the shrinking linear TV user base will push Nexstar into a disadvantageous position to negotiate favorable contract renewals. This deteriorating negotiation power will reflect poorly on Nexstar’s financial performance. Core advertising revenue, as depicted below, will continue to trend lower but will be saved by political ad revenue for now, leading to flat total revenue through 2028.
Exhibit 2: U.S. TV station advertising revenue
S&P Global
Second, as a local station owner, Nexstar does not have the luxury of selling content directly through a subscription service to consumers. In the recent past, major national networks have shown an increasing interest in launching subscription plans to sell their content directly to consumers to mitigate some of the losses resulting from a major decline in linear TV viewership. In the next decade, I believe the odds will tilt in favor of content owners as cord-cutting gains further momentum and content becomes the key differentiator. Nexstar will not be a winner in such an environment.
Third, eventually, I believe political ad spending will move toward streaming platforms at the expense of linear TV. This is not happening for now, I understand, but there is no denying that linear TV is a dying industry. During the midterm elections in 2022, political ad spending reached $7.8 billion, with $1.2 billion spent on OTT and CTV advertisements. This is just the beginning of a secular trend where ad dollars will eventually shift toward streaming, in my opinion.
Takeaway
Political ad spending will boost the U.S. ad sector this year, and Nexstar stands to emerge as a big winner, as it has always done during election cycles. That said, Nexstar’s long-term growth prospects are bleak, but I believe the company is on strong financial footing to support the dividend and offer investment returns on par with the S&P 500 in the foreseeable future. As an investor looking to beat the market, I could not find any catalysts that could drive NXST stock higher in the future.
Credit: Source link