

Oat_Phawat
Gold is one of the best-performing assets of 2024, rising by 15% year-to-date and 11% over the past month. Over that period, stocks and bonds have, for the most part, stagnated. Interestingly, the US dollar has also performed well this year, a rare instance of gold and the dollar rising together. Fundamentally, that may indicate a rise in monetary risks outside the US, causing foreign currencies to decline and gold to increase sharply. That said, gold remains risky because real interest rates are relatively high, implying that bonds are greatly oversold or gold may be overvalued.
An argument could be made for buying gold ETFs like (GLD) to take part in the ongoing bull market. However, gold miners, such as the giants like Newmont (NYSE:NEM) have, thus far, not taken part in the gold rally. NEM is down by around 7% this year, begging the question, is NEM not going to benefit from higher gold prices, or is it deeply oversold due to recent underperformance? NEM has lost its correlation to the price of gold, indicating either irrational negativity on the stock or a severe decline in its outlook.
I covered NEM over a year ago with a bullish outlook. Since then, gold has risen in value, as I expect. However, NEM has disappointed greatly, losing a quarter of its value since. Accordingly, I believe it is a pivotal time to analyze the gold bull market, with a specific focus on the profitability of Newmont’s operating model, to determine if it is either a fire sale opportunity or a value trap.
Why is Newmont Falling While Gold Rallies?
Newmont is the largest gold miner and accounts for about 12% of the popular gold miner ETF (GDX) holdings. The company is a giant in the industry with operations in North America, South America, Africa, and the Southeast Pacific. Last year, it produced 5.5M ounces of gold and 891K ounce equivalents of other metals. It reported a 2023 AISC of $1444 and markets itself as having a $1200 AISC, with the difference likely stemming from its assumptions regarding changes in currency values. Since NEM is a global company that produces a great deal in developing countries, currency volatility is a significant issue for the firm.
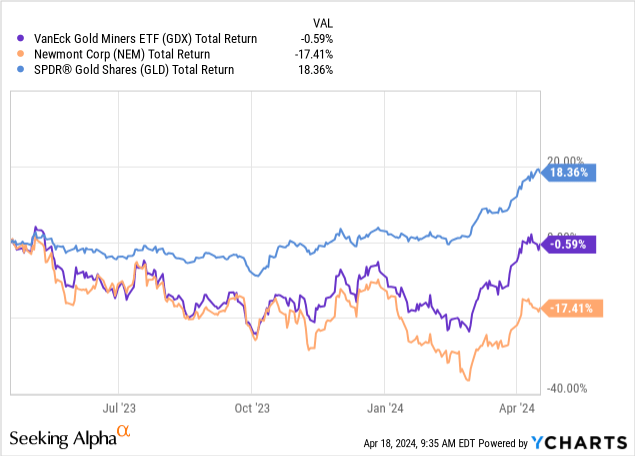
NEM’s performance compared to both gold and other gold miners is disappointing. NEM has lost over 17% YoY, while GLD has risen 18%, and GDX broke even. See below:
We can see this same data by taking ratios of the two, allowing us to see more clearly how the relative performance of NEM is trending compared to the benchmarks:
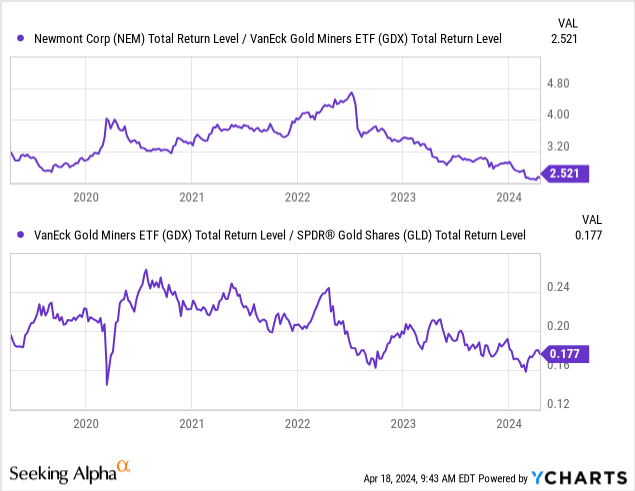
Based on these, we can see that the underperformance of GDX to GLD and NEM to GDX is both relatively steady. Since 2022, Newmont has consistently underperformed its smaller peers. At the same time, gold miners are not keeping up with the rally in gold. I believe this indicates that larger gold miners are seeing their production costs rise proportionally to gold, keeping their profits from rising accordingly.
Over the past decade, Newmont has not seen a marked rise in gold production, with annual output consistently around 5.5M ounces. However, its total operating costs have skyrocketed by over 200% since before 2020. See below:
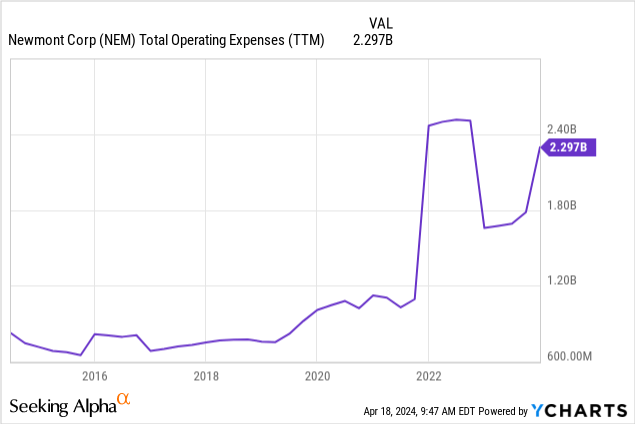
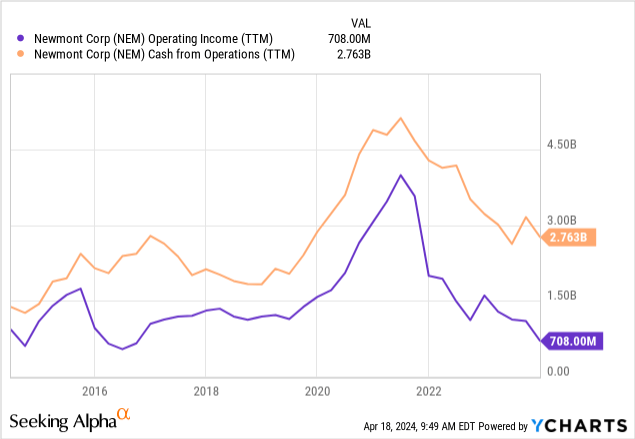
Put simply, all of the increased sales from higher gold prices since 2019 have gone into expenses. The company saw a sharp rise in profits around 2020-2021 as its sales prices rose while its operating costs had not yet kept up. However, the staggering rise in operating costs since 2022 has caused its profits to return to pre-COVID levels. See below:
In the past, I was aware of the issue of rising AISCs but believed that gold miners would inevitably see their cost growth stagnate as inflation slowed. Problematically, inflation has slowed globally but remains elevated and shows signs of rebounding, particularly when considering the importance of oil for gold production. I’m not so sure, particularly considering the social labor and economic issues in many key developing markets that Newmont has historically found most profitable.
For example, one of its essential mines in Mexico was shut down in a large labor strike last year. The strike ended with the company agreeing to a significant wage increase and back pay for lost wages since the strike began. While the US has increasing labor issues, the problem seems to be far more extreme in developing countries with rampant inflation and economic issues today. As those countries see their currency values decline, Newmont is not benefiting as those are resulting in increased labor action.
For the above reasons, I’ll assume Newmont’s AISC will be around $1600 on a forward basis, above the company’s $1444 2023 level but in line with its annual trend. According to the company, it wants an AISC of $1150 by 2027, stemming from synergistic capital investments. In my opinion, that is entirely unrealistic, given its trend and that of the industry. Labor and commodity costs continue to weigh, particularly with rebounding transportation and oil prices. Thus, I believe it is most realistic we assume an above-inflation trend in its AISC.
What is Newmont Worth Today?
The company will likely continue to produce around 5.5M ounces of gold and 891K in gold-ounce equivalents. Realistically, we’re not seeing significant upward price action in silver, copper, and lead as in gold, though notable gains have been in them recently. Roughly accounting for the potential discrepancies in how profitable “gold equivalents” are, I’ll roughly estimate using 6M at an AISC of $1600. Today’s $2390 gold price gives us a marginal profit of $790 per ounce.
The 6M ounce estimate gives an operating income estimate of $4.75B. The company’s TTM operating income is $708M, though that figure was as high as $4B two years ago during the peak spread between its AISC and the price of gold. Again, this is a very rough estimate as the price of gold and other metals may likely change, as well as its AISC. After deducting around $100M in interest costs (based on its $95M TTM) and a 25% tax rate, we arrive at a profit outlook of ~$3.48B, or about $2.3 per share. That is just above the consensus outlook estimate for 2024 of $2.08.
Newmont is a gold miner, and we can’t automatically assume that gold prices will continue to soar. Thus, I value it at a “P/E” of 15X on a forward basis, liberally accounting for the growing cost risks facing miners. Based on that, my fair-value price target for NEM is $34.5. Since NEM is not cyclical, a “P/E” up to 20X may be reasonable. As such, I believe NEM would be firmly overvalued at a price over $46. At $38, NEM is just above my preferred price but certainly not overvalued.
The Bottom Line
I hardly like to admit my previous estimates were wrong, but I must in NEM’s case. My past estimate did not assume the company would continue to face significant cost growth challenges. 2023 proved that labor, materials, and capital costs are in a sustained increase for the mining sector, with particular challenges in developing markets, which are seeing increased domestic labor unrest and extreme monetary stability issues. Newmont has excellent gold mines, but workers in those places are no longer happy with far lower wages than their counterparts in developed markets. High gold prices are great, but not if cost growth is equal.
Certainly, Newmont’s profits will rise with the recent increase in gold. Going forward, I would be surprised to see NEM continue to underperform gold, as its valuation seems to account for a relatively material increase in production costs. However, I am neutral on NEM today because I am skeptical of the gold rally. Gold is historically inversely correlated to real rates, but that relationship has broken over the past year. See below:
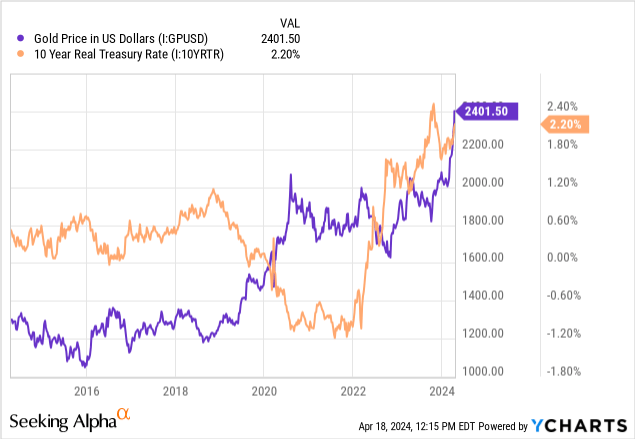
Gold is skyrocketing today with real interest rates, which is highly uncommon and does not make sense outside of certain assumptions. High real rates imply a good return on cash in bonds (after inflation), making gold (which has no natural return after inflation) a poorer bet. Today, the gold market seems to believe something the bond market won’t accept: that inflation will likely rise higher over the coming years. Either inflation and rates will increase, or gold will be significantly overvalued in a speculative rally.
If gold rises due to an increased outlook for monetary instability, it may be best to avoid NEM, as global monetary instability will exacerbate its cost troubles, even if gold’s price rises. On the other hand, if gold rises in a speculative rally, then NEM’s profit outlook may collapse if gold reverses toward the “real rate” price target below $1400 today. In my view, gold, unlike bonds, accounts for an inflationary rebound. However, I also believe the current gold rally is speculative, and that gold will face a correction soon unless real rates are strongly reversed. The latter will likely only happen if markets crash in a recessionary pattern.
I believe the silver ETF (SLV) offers a much better risk-reward profile at its current price than gold or gold miners. It is a good time to hedge against a rebound in monetary instability. Still, I feel gold is temporarily overvalued, and mining stocks like Newmont have limited upside because monetary instability adds proportionally to their production costs. My outlook for NEM is neutral, but for the most part, I think its downside risk is lower than its potential. I would be bullish on it if its price slips below $34.
Credit: Source link