

PM Images
This post describes my dividend growth portfolio and the strategy I use to build it. I have a high risk tolerance and my investing horizon is very long. This is why my portfolio is 100% equity with roughly 60% of my holdings in US stocks and 40% in Canadian stocks (I’m Canadian, should you wonder).
I’ve built the portfolio based on my 7 investing rules of dividend investing. I also manage 9 other portfolio models.
I split my holdings into two categories: a core portfolio generating dividend payments and a growth portfolio generating both dividend and stock value growth.
My Canadian Holdings
| Company Name | Ticker | Sector |
| Alimentation Couche-Tard (OTCPK:ANCTF) | ATD:CA | Cons. Staples |
| Brookfield Renewable (BEPC) | BEPC:CA | Utilities |
| CCL Industries (OTCPK:CCDBF) | CCL.B:CA | Materials |
| Fortis (FTS) | FTS:CA | Utilities |
| Granite REIT (GRP.UN) | GRT.UN:CA | Real Estate |
| Magna International (MGA) | MG:CA | Cons. Discre. |
| National Bank (OTCPK:NTIOF) | NA:CA | Financials |
| Royal Bank (RY) | RY:CA | Financial |
| Stella-Jones (OTCPK:STLJF) | SJ:CA | Materials |
Are you looking to improve your Canadian picks? Here is how I do it.
My US Holdings
| Company Name | Ticker | Sector |
| Apple | AAPL | Inf. Technology |
| Automatic Data Processing | ADP | Industrials |
| BlackRock | BLK | Financials |
| Brookfield Corp. | BN | Financials |
| Home Depot | HD | Cons. Discret. |
| LeMaitre Vascular | LMAT | Healthcare |
| Microsoft | MSFT | Inf. Technology |
| Starbucks | SBUX | Cons. Discret. |
| Texas Instruments | TXN | Inf. Technology |
| Visa | V | Inf. Technology |
Each month, I publish my results. Not to brag, but rather to show my readers that it is possible to build a lasting portfolio during all market conditions.
If you’ve been following me, you already know that I quit my job to live my dream; building my own online business. I focus on helping people invest correctly by saving them from the eternal buy/sell struggle. Here, I share the strategy I devised and used to build and manage a relatively small portfolio of $192K (since July 2016) as it makes its way to becoming an iconic million-dollar portfolio.
Many bloggers, financial writers and planners have highlighted the math behind reaching a seven-figure portfolio. In fact, it’s quite easy. You can reach any investment goal by following those simple rules:
#1 – Start early
#2 – Save a lot
#3 – Stay invested
Nice plan and it works. Unfortunately, not everybody starts investing in their 20s. Most people don’t have $2,000 to invest monthly either. Note that I used the start instead of be capable of. We are all capable of investing, but we don’t all share the same priorities. For this reason, I much prefer showing you how to manage your portfolio rather than telling you need to save X amount during Z years to get rich and retire early.
My Situation
I’m 43, married, and I have three children of 12, 17 and 19. I’m the only income provider to my family. In 2016, I took 12 months off to travel North America and Central America in a small RV with my family. You can tell saving money aside isn’t exactly my #1 priority. However, I have managed to amass over $200K in investment already. I achieved this milestone using the three simple rules mentioned above.
#1 – I started investing at the age of 23.
#2 – I saved about 20% of my income in my retirement plan.
#3 – After I bought my second house at the age of 26, I never got out of the market.
I could have gathered a lot more, but I preferred traveling, eating at nice restaurants, and enjoying activities with my family. As I said, it’s all about priorities. Now, the important part: how do I make my 192K become 1 million dollars before I turn 60?
Quick Numbers
Using a classic investment calculator found on the internet (I used Calculator.net), I figured I need about $500 per month invested at a 6% to reach $1M mark by the age of 59:
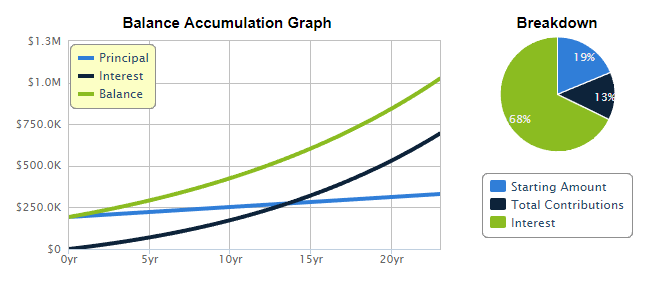
To be exact, I need to save $457 monthly. Interestingly enough, if I can boost my investment return to 7.43%, I have to save a big fat $0 and still reach my objective. That’s the true power of compounding interest!
I said this isn’t an article about saving X amount during Z years to get rich and retire early. Instead, I explain how I will invest that money. Because in the end, if I can make a 7.5% return, I don’t even have to worry about the amount I’m saving. That’s what I call thinking outside the box.
My Focus on Dividend Growth
My nickname, “The Dividend Guy”, tells you that I focus on dividend investing to fund my retirement. However, I’m more a “growth” guy than an “income” -focused investor. I began investing by trading stocks weekly and adding a few penny stock trades in the basket. I quit this strategy mainly because it’s time-consuming and, once in a while, you hit your teeth on the wall and it hurts.
Since 2010, I’ve focused on companies with a solid dividend growth history. The word “growth” is the most important one. I want companies to increase their payment by high single to double-digit numbers. Companies paying a 5% yield or showing 40 years of dividend history, but that don’t have dividend growth aren’t a fit for my strategy.
Using the Dividend Triangle, I select companies with potential for revenue, earnings, and dividend growth. No company can make more profit over the long haul without a growing business. And no company can increase its dividend without first increasing its profit. Finally, a company showing strong dividend growth is usually confident that the first two factors will kick in.
Since I don’t want to screen the whole market, I often start my research with our own Dividend Stocks Rock (DSR) Dividend Rock Stars list. The list includes only companies with solid metrics and robust business models, qualities that put them among the best dividend stocks. Companies make it to the list based on the three metrics of the dividend triangle. We feel that it’s a stronger list than the dividend aristocrats because we consider more than dividend growth. The Dividend Rock Stars list includes around 40 financial metrics. You can use filters to identify the perfect stock for you.
Then, using YCharts, I find companies with strong dividend growth over the last five years. Some pearls will have only five to nine years of consecutive growth, therefore fly under the radar of many investors. Using my straightforward strategy and stock screener, I was able to find hidden gems such as Visa (V). These are the same investing rules that helped me build highly performing portfolios in Dividend Stocks Rock.
Portfolio Building
Building a list of stocks is fun, but doesn’t make a portfolio. There’s much more to building a portfolio than picking companies you like that have strong fundamentals. The problem is that all stock lists are biased. Why? Because they’re made at a specific moment in time, and at that moment, some sectors might be outperforming others, which won’t last forever. Just think of Canadians building their portfolio with plenty of REITs and Oil Income Trusts back in the early 2000s. Or an investor in 2009 or 2010 that would not pick a single financial stock because they all showed bad fundamentals; investors who did pick good financial stocks back then are very happy they did.
Good reasons to force yourself to pick companies in several sectors instead of simply picking the best of the breed of the moment. Picking all stocks from the same sector is like building a hockey team with only centers and left wings. You need defensemen and goalies too!
When building a portfolio, I want to invest in various sectors. The goal is to get a smoother growth trend and avoid making huge mistakes. Imagine investing 50% of your portfolio in a single sector and the industry goes through some serious challenges? Your portfolio value might hurt for a while or, worse, never recover at all. Here’s my current portfolio sector allocation:
Dynamic sector allocation calculated by DSR PRO as of April 5, 2024.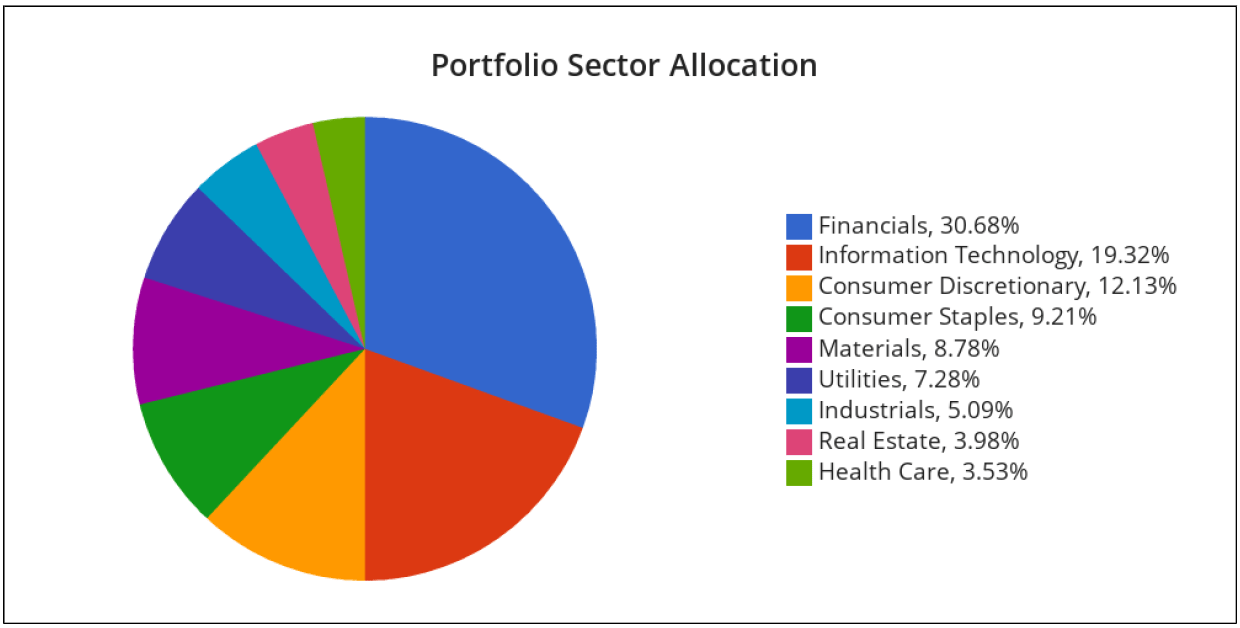
I want a solid and stable portfolio. The bulk of my money is in the financials, information technology, and consumer discretionary sectors. You might not equate information technology as a solid and stable; however, the stocks I own in this sector are mature, well-established companies with proven track records and areas for growth (MSFT, TXN, AAPL). These are not highly volatile disruptive technology companies vying for market share.
I’m not a fan of energy stocks for my dividend growth portfolio. This is because they are cyclical and volatile, making it harder to forecast future payments.
My goal isn’t to have the most diversified portfolio ever. Since I aim for a 7%+ return, I must concentrate on specific sectors. I think that investing about 32% in tech and consumer discretionary will help me catch bullish waves, for example.
Core & Growth…
My portfolio asset allocation is divided into two types of stocks: core & growth. The core portfolio is built with strong & stable stocks meeting all my requirements. The second part is called the “dividend growth stock addition” where I may ignore some of my investing rules because I believe there’s an opportunity.
While the core section is like any other dividend growth portfolio, the growth segment requires closer follow-up. This is the part of my portfolio likely to generate the most volatility… but possibly the highest level of profitability.
Those picks come and go as there is an opportunity on the market; it’s the salt in my Salted Caramel Latte for Halloween. It’s what makes investment interesting and exciting!
For growth stocks, my investment horizon is reduced to 12-18 months. An example is when I bought SNC Lavalin back when the company was implicated in a lawsuit from the RCMP for fraud. SNC is a leader in an engineering firm; a few clowns who committed fraud would not sink the whole company. SNC shares slowly got back on track and I sold mine with a nice profit about 18 months later.
To protect my profit when I make such trades, I use stop sell orders. I don’t use them for my core holding (I really don’t mind showing a + 175.93% return on AAPL). I only do it when a risky stock reaches my target of a healthy profit quickly.
A Good Example of Stop Sell
You might not want to sell a stock that’s highly profitable because it could keep going up. On the other hand, you don’t want to lose all that profit if it starts going down. Using a stop-sell order is a good strategy to use to protect some of your profit. A stop-sell order lets you start selling a stock at a specific price. This protects your profit, or minimises your loss, when the price starts to go down.
I don’t carry many “calculated gambles” in my portfolio, but I do like the occasional small bet. I guess it’s my old day trader days coming back to me! At one time, I had Qualcomm (QCOM) in my portfolio. The company was having problems with antitrust rules and fighting both the Chinese government and Apple (AAPL). That bad news caused QCOM stock to drop sharply, and I picked up some shares in the low $50s. At that time, the stock was down by over 20% since the beginning of the year.
Then, three major events happened in a single week! First, a rumor that Apple could drop Qualcomm for its next iPhone generation. Then, management published robust earnings (considering the situation). Finally, another rumor about Broadcom (AVGO) that could purchase QCOM at $70+ a share. Here’s what happened on the market:
Source: YCharts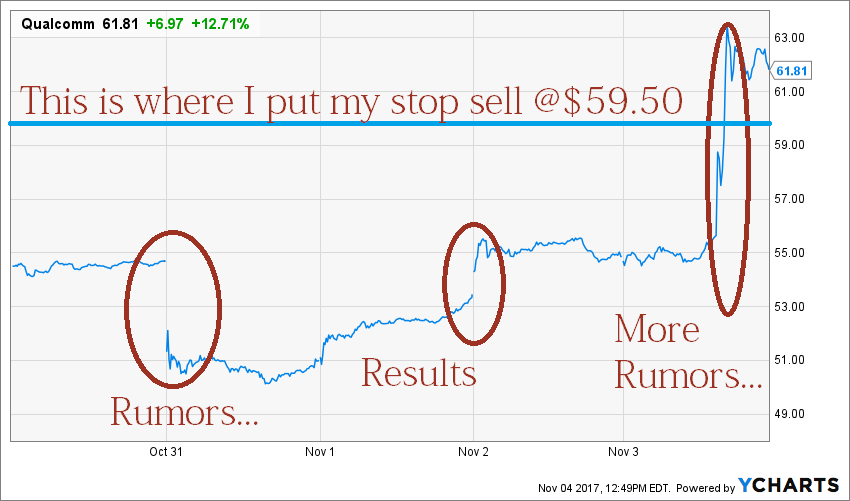
You see lots of volatility around the stock. I purchased QCOM at $50 right before all that happened. I thought it could go higher if the Broadcom rumor was true. After all, Broadcom was expected to pay over $70 per share. I didn’t want to miss that chance. On the other hand, if the rumor fell short or the deal failed, I knew QCOM would drop like a rock. I wasn’t going to waste a unique opportunity to cash in on a 20% return over two months. I wanted to hold QCOM in case it went up, but I put a stop sell at $59.50 to secure my profit. The rumor that AVGO wanted to acquire QCOM was confirmed. The stock jumped to $64 on opening. I sold at $64.90 on that day because I had another stock on my radar.
It’s worth repeating that I don’t use stop-sell on my holdings in general. The reason is simple: I intend to hold them for years, decades… even for life! However, I also allow a part of my capital to be invested in riskier picks to generate additional growth. The goal is to hold this pick for a maximum of two years based on my investment thesis. QCOM had already generated enough return to fit in this strategy. I was then able to realize a 29% profit and use the proceeds and buy another falling knife… Shopify (SHOP).
Valuation
Ah! The never-ending debate about valuation! There isn’t a single investor who doesn’t wonder: “Is this a good price to buy XYZ? Is it a bit overvalued?”
I try to include a valuation process in my stock analysis. However, it’s far from the most important pillar of my process because valuation changes all the time. It does because we use data from the past to come up with a value in the present that reflects the future of a company. Does that make sense? Not really. That’s why I’d rather pick strong companies that are “overvalued” than weak ones that are “undervalued”.
My valuation process includes two steps. The first is quite simple; look at the past 10 years’ history of PE ratio. This gives me a good indication of how the market values a stock. For example, you can see that the 2016-2018 Texas Instruments (TXN) stock run wasn’t PE expansion; the company was more money than ever and the PE ratio was pretty stable throughout:
Source: YCharts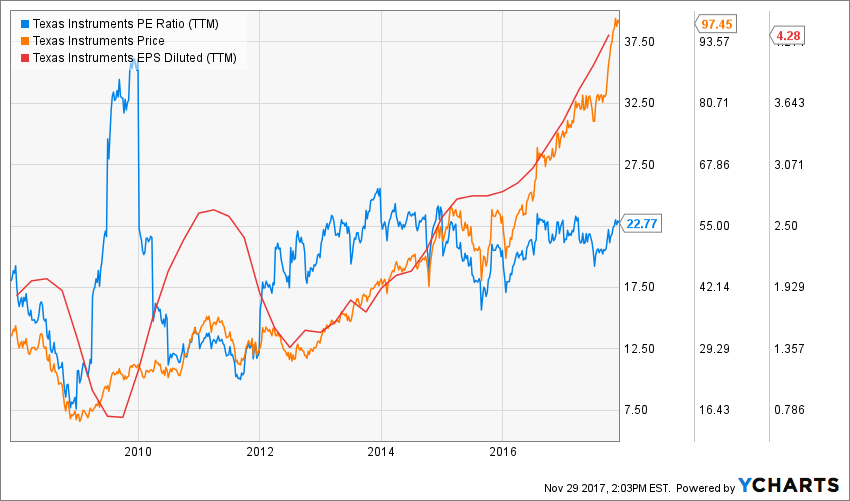
This method gives more of a hint than a real valuation. It shows whether the market is currently giving a company a strong valuation or not. Then, I start digging to find out why.
The second method I use is the dividend discount model (DDM). The idea is to look at an individual share as a small free cash flow machine, and the dividends as the free cash flow.
An entire company can spend its free cash flow on dividends, share repurchases, acquisitions, or just let it build up on the balance sheet; we have little control over what management decides to do with it.
The dividend, however, takes all of this into account; the current dividend and the estimated growth of that dividend considers the free cash flows of the company and how management uses them. Here’s an example of the results of my calculation on TXN.
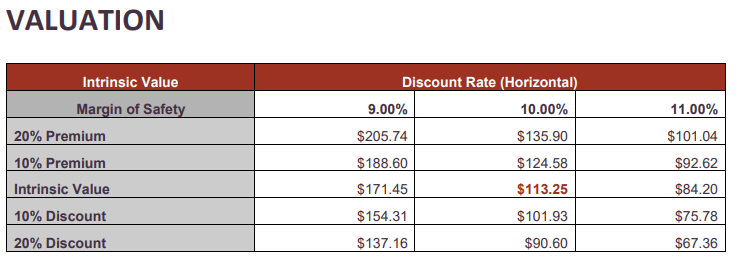
The DDM isn’t perfect, far from it. Please read the Dividend Discount Model limitations to fully understand my calculations.
Final Thought
I know… this was a long read. However, if you’re starting your adventure in the stock market, this is the kind of reading you need. I’ve spent hours working on my investment methodology and I follow it to the dot. This is my secret for being successful on the stock market. I don’t know everything. I’m not the smartest cookie in the room. But I know that my method works and that it is my best bet for success.
Original Post
Editor’s Note: The summary bullets for this article were chosen by Seeking Alpha editors.
Credit: Source link