
mysticenergy
When I was checking some other analyses on Whitecap Resources (TSX:WCP:CA) (OTCPK:SPGYF), I was curious about what assumptions one must make to arrive at a Hold rating. What I found is that some authors simply value the company based on a single number, such as the current free cash flow yield. Well, I believe that valuation is a bit more complex. To see a full picture for Whitecap, one has to consider the Capex cycle with production growth, change in production mix, decline rates, and expenses, debt repayments scheduled to arrive at a point where we can estimate how much free cash flow will likely be paid to investors and how high is the potential sustainable free cash flow in case the company decides to switch to a 100% payout.
With a robust asset base, clean balance sheet, and strategic acquisitions/dispositions, I believe that Whitecap is positioned to deliver above-average returns to its shareholders via a large 7.4% dividend yield, strategic buybacks, and a strong growth plan.
Q2 Update
Whitecap has delivered very strong quarterly results. The production averaged over 177,000 boe/d, well over the forecast of 170,500 boe/d (64% liquids).
Whitecap’s Q2 results (Authors diagram – based on Whitecap’s financial report)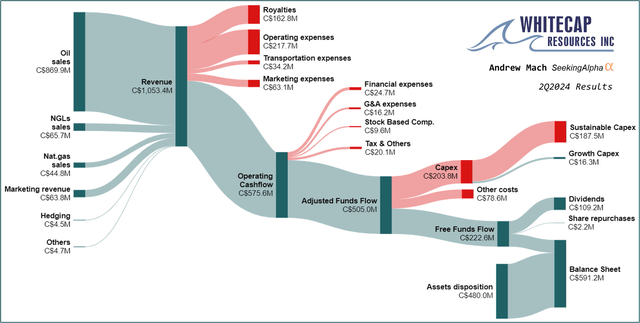
TMX impact – As you can see, despite the 36% gas in the production mix, the majority of the revenue came from oil. In my original thesis, I discussed the potential boost from narrowing the WTI-Canadian light oil differential due to the TMX pipeline. The impact so far hasn’t been as stellar as the expectations, but when you compare Whitecap’s realized prices to WTI, they achieved 93% of the WTI, compared to 90% in previous quarters.
Financials – Due to the stronger oil prices for the quarter and higher than expected output, Whitecap generated over C$1B in revenue and C$222M in FCF, which more than covers the monthly dividend payments, which costs the company C$109M per quarter, yielding a 7.4%. All this while spending for growth and significantly improving the balance sheet.
Asset sale – While it hasn’t hit the company’s account during Q2, I included the proceedings of C$480M from the disposition (Page 4 of Corporate presentation) of the Musreau Facility & Kaybob Complex in the cash flow diagram. In my original thesis, I wrote that while very similar, I prefer Veren (VRN:CA) over Whitecap due to the higher potential activity in acquisition from Whitecap. I must admit that transactions like those that Whitecap made over the past quarter are highly welcome and provide a large boost to the company’s value, as well as reputation to the management. Making a C$480M while the impact is just ~C$11M lower Funds Flow is simply stunning.
Update To The Projection
WTI is currently hovering in the range of US$70-75. While I am using US$75 as my base case, I am going to follow with a sensitivity analysis to assess the valuation.
Assumed commodity prices (Author’s projection model)
Q2 production output is already suggesting that the growth might be even faster than anticipated, but I am still modeling the base case with a guided five-year growth plan from the company. In case of higher oil prices, Whitecap can utilize some of its C$1.9B undrawn debt capacity to boost production output by an additional 20.000 boe/d.
Production & realized prices (Author’s projection model)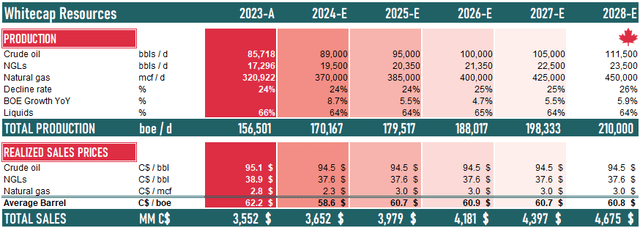
During the call, management suggested that they expect a potential boost to cash flow from the operating cost savings, as a higher production scale could lead to lower operating costs. I am counting a medium savings from the guided range.
Costs (Author’s projection model)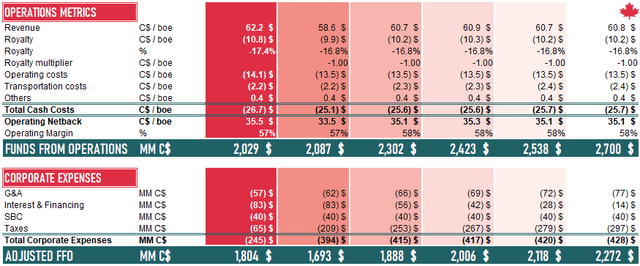
As you can see, I expect the maintenance Capex to grow from the current C$750M to ~C$1B due to a higher production output but also slightly higher decline rates due to more gas in the production mix.
Capex, Debt & FCF (Author’s projection model)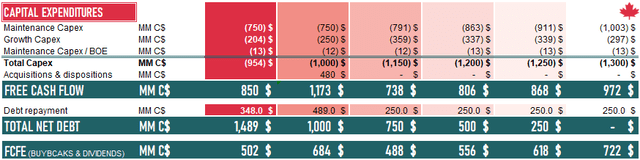
The summary of the projection is on the graph below.
Full five years projection (Author’s projection model)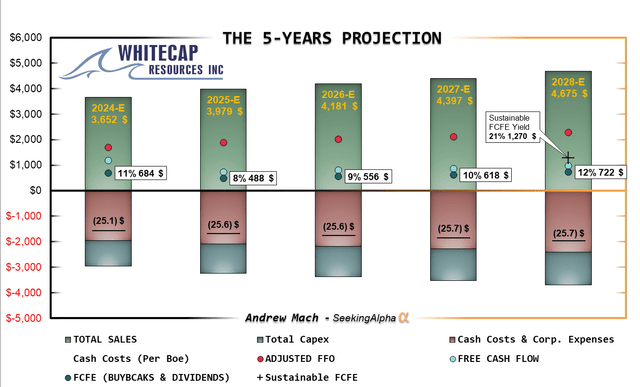
With a US$75 WTI and C$3 AECO, we can expect the company to continue paying its 7.4% dividend yield. At the same time, Capex stays elevated to grow production by a 6% CAGR from the 2023 level. It still has remaining capital to clean out the debt from its balance sheet completely, and some remaining capital to execute buybacks.
Moreover, if the company decides to stop growing and just maintain production, we could see a 21% sustainable FCF yield.
Discounting these cashflows back, the market currently offers the shares for 17.5% yearly returns. While many mid-cap oil stocks trade for a 15% return (75WTI), I believe that Whitecap is the above-average quality company and deserves to trade closer to a 12.5% return, which would imply a 46% upside to the share price.
FCF discounted by different discount rates (Author’s calculation)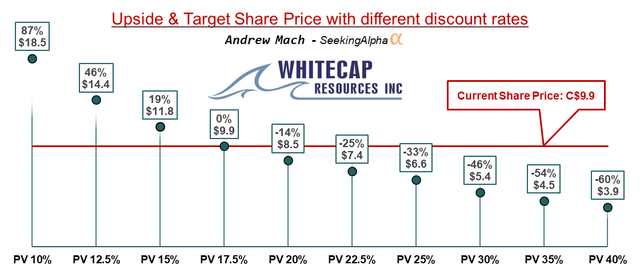
Uncertainty
Remember that every single cell in the projection model is subject to uncertainty. The management will react and change the plan if the commodity prices make a big move.
Sensitivity analysis (Author’s calculation)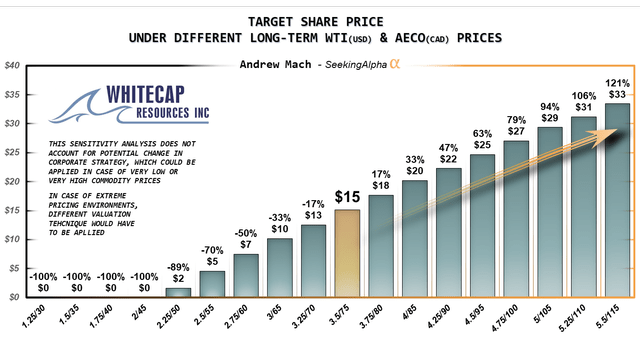
I am running a PV12.5 valuation with different oil and gas prices. We can see that a move of US$5 in WTI moves Whitecap’s FCF by about 17%. The shares appear to be fairly priced at US$65 WTI. If you are bullish on oil and accounting for long-term US$85 WTI, the upside to a fair price is nearly 100%. On the other hand, the break-even is around US$45WTI, while management claimed during the Investor’s Day Presentation that they could sustain the dividend at US$50WTI. In such cases, cost-cutting measures would have to take place by eliminating the spending for growth.
Conclusion
The Q2 was proof that Whitecap is progressing better than expected in its long-term growth plan, and the stunning disposition cleaned the balance sheet faster than expected. Considering the growth, dividends, low break-even prices, long-lasting reserves, and very clean balance sheet with high optionality, I cannot emphasize how good a deal Mr. Market offers to long-term investors with Whitecap. Even with conservative assumptions, the DCF analysis suggests a 17.5% yearly return.
Editor’s Note: This article discusses one or more securities that do not trade on a major U.S. exchange. Please be aware of the risks associated with these stocks.
Credit: Source link