
David Becker
Thesis
In my previous article on Microsoft Corporation (NASDAQ:MSFT), I established a fair share price of $371.6. At that time, this valuation indicated an upside of 13.4%, and I also projected a future price of $587. Subsequently, the stock surpassed my expectations by increasing by 16.84%.
In this article, I will assess whether Microsoft still holds potential for further growth. I will employ two discounted cash flow [DCF] models: one based on analysts’ estimates and a second one reflecting my own projections. While the analysts’ estimates suggest a fair valuation, my models indicate a potential 14.1% increase in the stock. However, as both models did not yield undervalued results, I am downgrading the stock to a “buy” recommendation, setting a revised target price of $436.9.
Seeking Alpha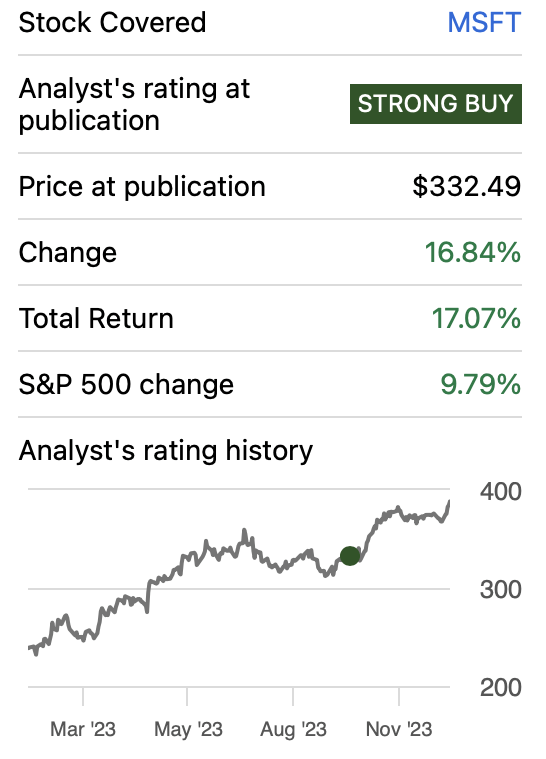
Overview
Productivity & Business Processes
Microsoft’s Productivity and Business Processes segment comprises a diverse array of products and services aimed at enhancing productivity, communication, and information services across various platforms and devices. This segment includes Office Commercial, which encompasses Office 365 subscriptions, Office 365 within Microsoft 365 Commercial subscriptions, and on-premises Office licenses, providing a comprehensive suite of productivity tools. Additionally, it features Office Consumer, which includes Microsoft 365 Consumer subscriptions and other Office services. LinkedIn, with its Talent Solutions, Marketing Solutions, Premium Subscriptions, and Sales Solutions, is also a part of this segment, along with Dynamics business solutions, featuring Dynamics 365’s intelligent, cloud-based applications for ERP, CRM, Power Apps, and Power Automate. This market is expected to deliver a CAGR of around 15.29% throughout 2029.
Intelligent Cloud
Within the Intelligent Cloud segment, Microsoft offers an extensive range of public, private, and hybrid server products and cloud services, empowering modern businesses and developers. This segment comprises server products and cloud services like Azure, SQL Server, Windows Server, Visual Studio, System Center, and related Client Access Licenses. The worldwide public cloud market is expected to grow at a CAGR of 15.66% from 2023 to 2028.
Statista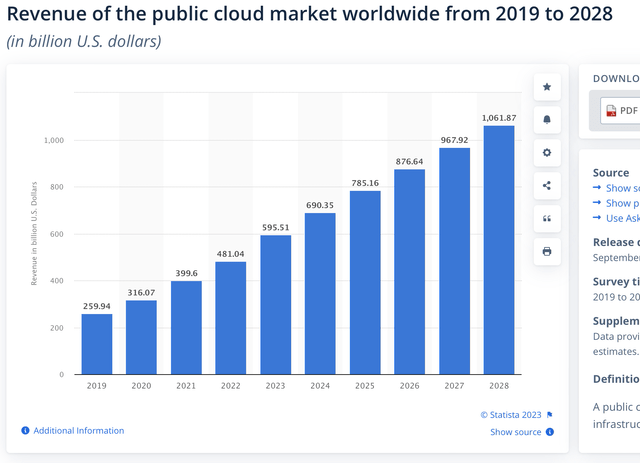
More Personal Computing
Finally, the More Personal Computing segment focuses on creating a customer-centric technology experience. It offers Windows operating system products, including OEM licensing, Windows Commercial volume licensing, and Windows cloud services. This segment also encompasses Devices, featuring Surface, HoloLens, and PC accessories. The Gaming aspect includes Xbox hardware, gaming content, Xbox Game Pass, and related subscriptions. Furthermore, Search and news advertising encompass Bing, Microsoft News, Microsoft Edge, and third-party affiliates, fostering a user-centered approach to technology and entertainment within this segment.
Financials
Microsoft has demonstrated a remarkable revenue growth rate of 16.3%, even considering its substantial size as a company. From Q4 2023 to Q1 2024, Microsoft saw a commendable 3.01% increase in its trailing twelve-month [TTM] revenue.
The upward trajectory continues with operating income, showing a robust growth rate of 28.4%. Over the period from Q1 2023 to Q1 2024, operating income increased by 7.15%. However, this pales in comparison to the remarkable annual growth witnessed in net income, soaring at approximately 60.9%. In the mentioned quarter-to-quarter span, net income increased by a decent 6.54%.
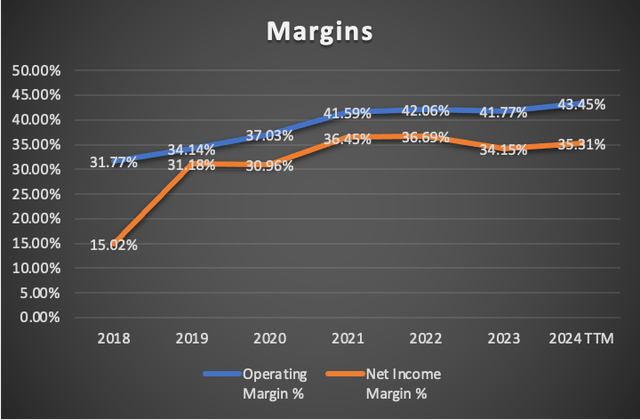
Maintaining robust margins is another feather in Microsoft’s cap, with both operating and net income margins surpassing the 30% mark. Notably, the net income margin stands at 35.31%, while the operating margin is an impressive 43.45%. Over the period from Q4 2023 to Q1 2024, both margins increased by 1.68% and 1.16%, respectively.
Author’s Calculations Author’s Calculations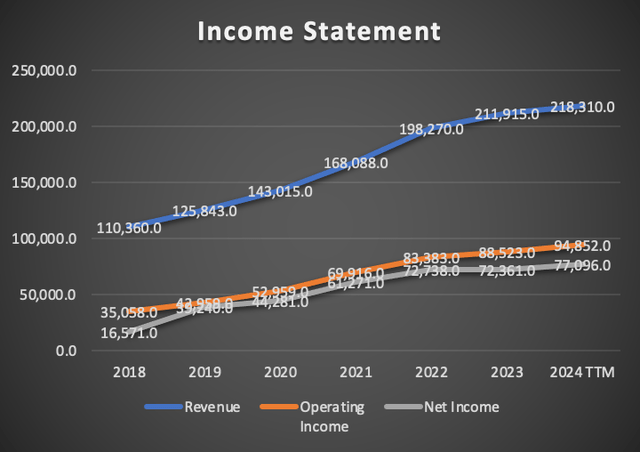
Microsoft’s balance sheet remains resilient, with cash reserves covering around 60.3% of its total debt load. The cash reserves have exhibited substantial growth, with an annual rate of 95.6% since 2017. In contrast, total debt has grown at a modest annual rate of 3.5% since 2017. From Q1 2023 to Q4 2024, total debt increased by $26 billion, reflecting a 33% increase, while cash surged by 131%, resulting in a nominal increase of $45.7 billion.
Author’s Calculations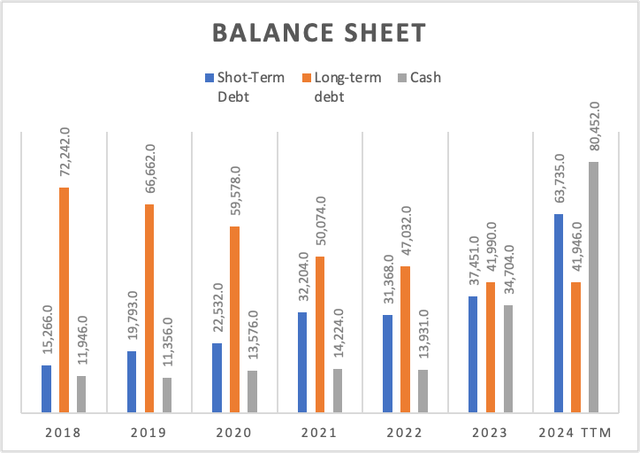
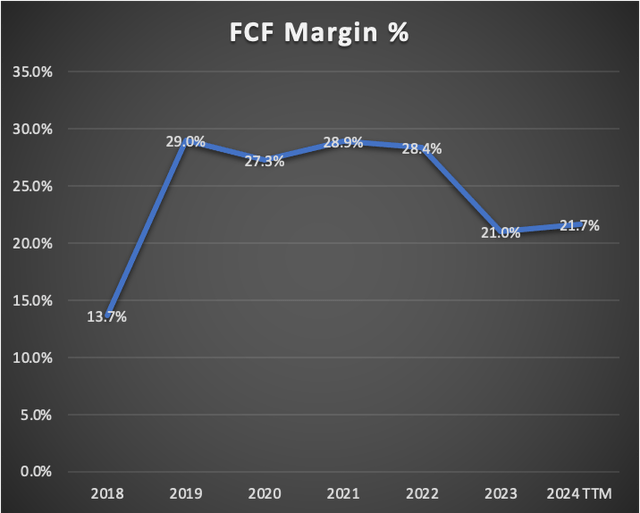
Microsoft’s free cash flow continues to underscore its financial strength. Currently generating approximately $47.33 billion in free cash flow on a trailing twelve-month [TTM] basis, this reflects a noteworthy 6.31% increase from Q4 2023. Although the free cash flow margin remains robust at 21.7%, it’s worth noting a gradual reduction from the 2018 margin of 29%. Despite this, the overall trend in free cash flow is positive, experiencing a robust growth rate of 35.6%. This consistent growth contributes to Microsoft’s financial stability and underscores its ability to generate substantial cash reserves.
Author’s Calculations Author’s Calculations Author’s Calculations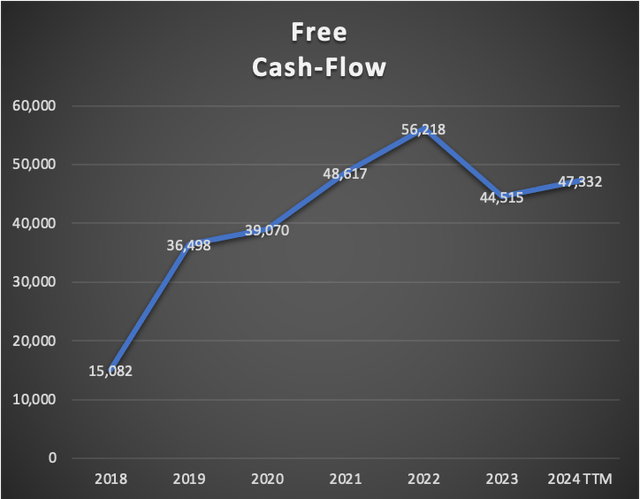
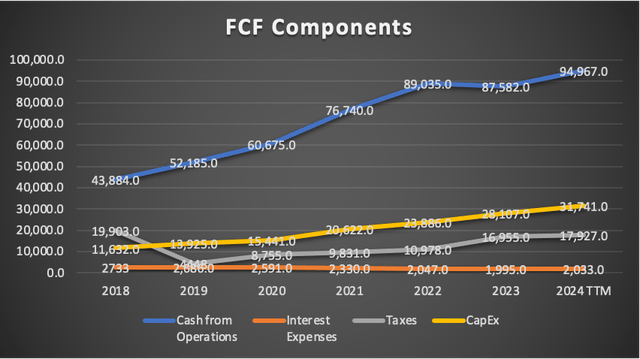
In conclusion, Microsoft stands out as a robust company, showcasing impressive revenue and net income growth, maintaining a solid balance sheet, and exhibiting substantial free cash flow growth—an admirable feat for a company of its magnitude.
Valuation
In this valuation analysis, I will employ two Discounted Cash Flow [DCF] models to gauge Microsoft’s intrinsic value. The first model integrates Analysts’ estimates for revenue and EPS in FY2024 and FY2025, alongside forward revenue growth and the 3 to 5-year long-term EPS growth rate.
The second DCF model is rooted in the anticipated market revenue projections for each of Microsoft’s operating segments.
The provided table encapsulates all current data pertinent to Microsoft. Using this data, I will calculate the Weighted Average Cost of Capital [WACC] by factoring in Equity value, Debt value, and Cost of debt. Additionally, Depreciation and Amortization (D&A), Interest, and Capital Expenditures [CapEx] will be computed based on margins linked to revenue growth. This method ensures that as Microsoft’s revenue expands, these expenses will also increase, providing a more pragmatic and coherent projection.
Author’s Calculations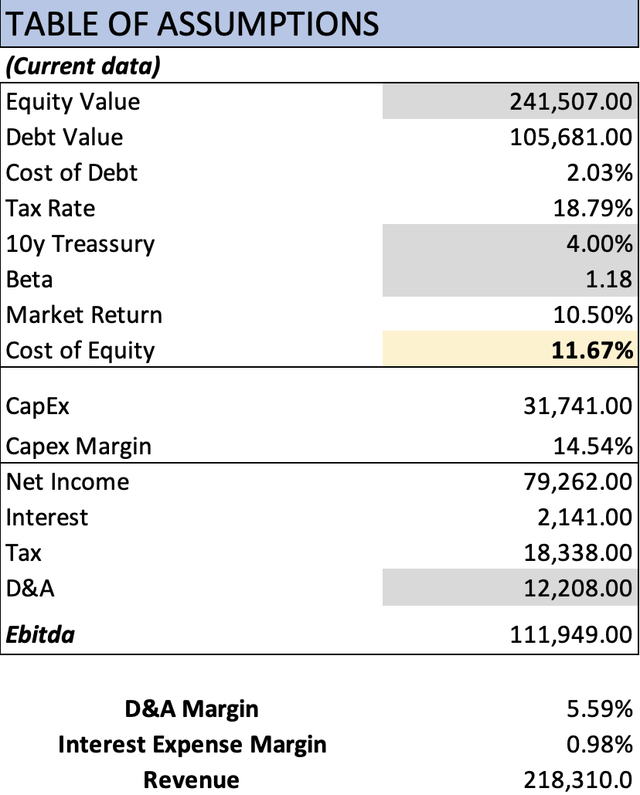
Analysts’ Estimates
In this preliminary model, I will evaluate Microsoft based on current analyst estimates. Commencing with revenue, FY2024 projections indicate an expected figure of $251.7 billion, with analysts anticipating a subsequent increase to $286.38 billion for FY2025.
For EPS, forecasts are set at $11.21 for FY2024 and $12.88 for FY2025. When multiplied by the total number of shares outstanding, these estimates result in net incomes of $83.3 billion and $95.7 billion , respectively. This trajectory signals a significant upside of 14.8% from FY2024 to FY2025, reflecting a mid double-digit growth.
Analysts also project a forward revenue growth of 11.82%, which will serve as the basis for projecting revenues beyond FY2026. Additionally, a 3 to 5-year EPS growth rate of 14.61% is expected, providing a foundation for projecting net income in the model.
The last part is to add the same data but for Activision Blizzard since its acquisition finally passed through and therefore it is appropriate to merge both s’ data. Activision Blizzard’s expected revenue growth rate is of 13.83%. and a 3-5y long-term EPS growth rate of 9.97%, that will be employed to calculate net income.
| Revenue Activision | Net Income Activision | Revenue Microsoft | Net Income Microsoft | |
| 2024 | $8,706.0 | $2,166.00 | $251,706.0 | $83,301.51 |
| 2025 | $9,158.7 | $2,359.42 | $286,380.7 | $95,711.28 |
| 2026 | $9,635.0 | $2,570.12 | $320,230.9 | $109,694.70 |
| 2027 | $10,136.0 | $2,799.63 | $358,082.2 | $125,721.09 |
| 2028 | $10,663.1 | $3,049.64 | $400,407.5 | $144,088.95 |
| 2029 | $11,217.5 | $3,321.97 | $447,735.7 | $165,140.34 |
| Revenue | Net income | Plus Taxes | Plus D&A | Plus Interest | |
| 2024 | 260,412.00 | 85,467.51 | $98,952.98 | $113,028.50 | $115,497.02 |
| 2025 | 295,539.42 | 98,070.70 | $113,694.41 | $127,769.93 | $130,238.45 |
| 2026 | 329,865.88 | 112,264.82 | $130,305.16 | $148,212.63 | $151,353.18 |
| 2027 | 368,218.19 | 128,520.73 | $149,342.75 | $169,366.88 | $172,878.64 |
| 2028 | 411,070.58 | 147,138.58 | $171,161.72 | $193,552.70 | $197,479.56 |
| 2029 | 458,953.23 | 168,462.31 | $196,168.45 | $221,206.05 | $225,597.06 |
| ^Final EBITA^ |
Author’s Calculations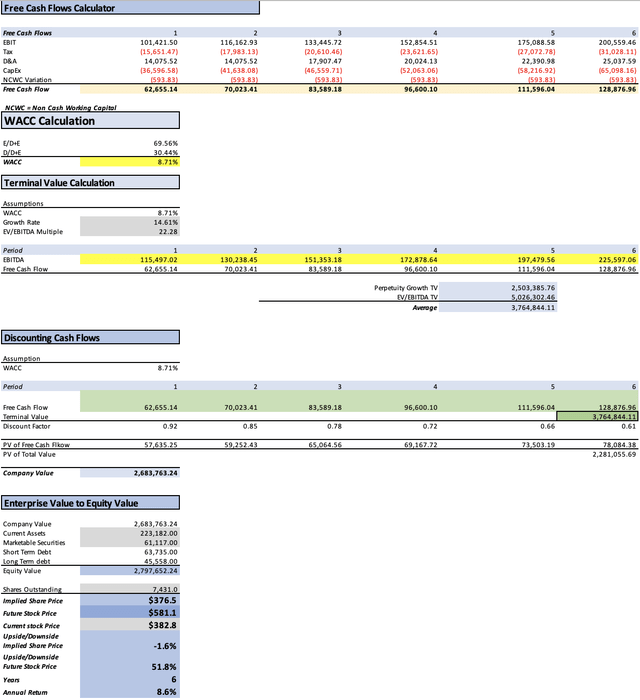
Upon analysis, according to this model, Microsoft appears slightly overvalued with a suggested downside of -1.6%, indicating a fair price per share of $376.5. Looking ahead to 2029, the stock is projected to be valued at $581.1, suggesting a fair price for that year should be $581.1, translating into annual returns of 8.6%.
My Estimates
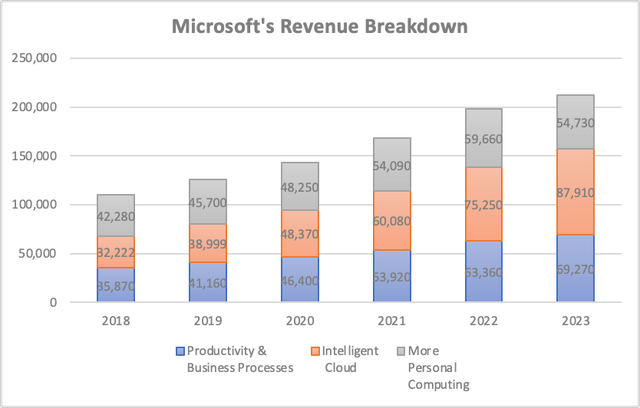
As mentioned earlier, in this second valuation model, I will project each of Microsoft’s segments based on their respective market growth rates. Specifically, productivity & business processes will grow at a CAGR of around 15.29% throughout 2029, while intelligent cloud will be growing at a CAGR of 15.66%, and finally more personal computing, since it’s too diverse, and too volatile because of Xbox, and Microsoft laptops, I will be projecting it using the average revenue growth rate from 2018 to 2023 TTM which is 5.56%.
In the table and bar graph below you will be able to see the historical growth of Microsoft’s revenue by segment.
The average annual growth is in green while the % of revenue is in black (Author’s Calculations) Author’s Calculations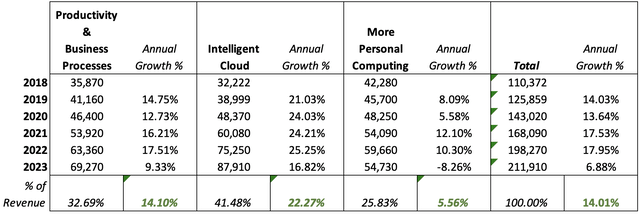
| Revenue Activision | Productivity &Business Processes | Intelligent Cloud | More PersonalComputing | |
| 2023 | 8,706.00 | 69,275.01 | 87,902.34 | 54,737.64 |
| 2024 | 8,706.00 | 79,839.45 | 101,667.85 | 57,781.06 |
| 2025 | 9,158.71 | 92,014.97 | 117,589.03 | 60,993.68 |
| 2026 | 9,634.97 | 106,047.25 | 136,003.48 | 64,384.93 |
| 2027 | 10,135.98 | 122,219.46 | 157,301.62 | 67,964.74 |
| 2028 | 10,663.05 | 140,857.93 | 181,935.05 | 71,743.57 |
| 2029 | 11,217.53 | 162,338.76 | 210,426.08 | 75,732.52 |
| % Of Revenue | 32.69% | 41.48% | 25.83% | |
| Growth Rate % | 15.25% | 15.66% | 5.56% |
| Revenue | Net income | Plus Taxes | Plus D&A | Plus Interest | |
| 2024 | 247,994.36 | 80,011.43 | $120,513.03 | $125,098.74 | $125,881.74 |
| 2025 | 279,756.40 | 90,174.96 | $139,385.37 | $143,971.08 | $144,754.08 |
| 2026 | 316,070.63 | 101,784.69 | $161,213.12 | $167,304.12 | $168,344.14 |
| 2027 | 357,621.80 | 115,057.11 | $186,459.09 | $193,478.97 | $194,677.60 |
| 2028 | 405,199.61 | 130,241.80 | $215,658.59 | $223,749.00 | $225,130.42 |
| 2029 | 459,714.89 | 147,626.48 | $249,430.72 | $258,754.92 | $260,347.00 |
| ^Final EBITA^ |
Author’s Calculations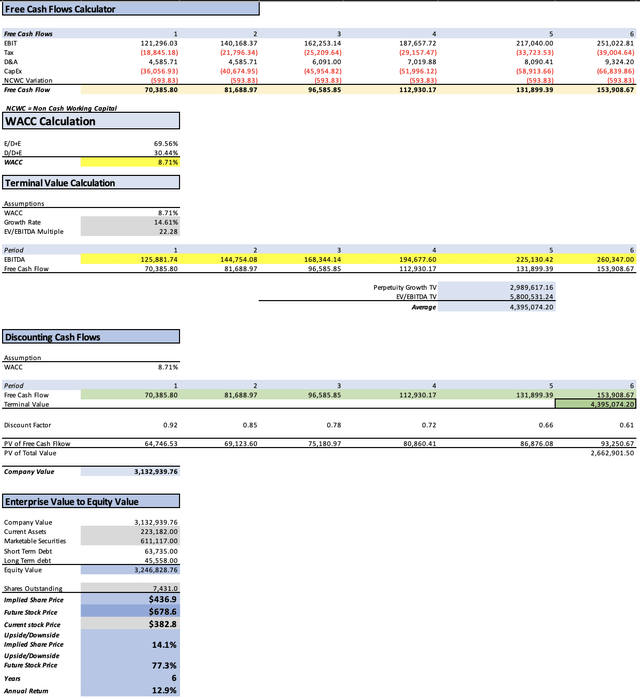
In conclusion, as revealed by this model, Microsoft exhibits continued potential for growth. The suggested fair price stands at $436.9, reflecting a promising 14.1% upside from the current stock price of $382.8. Looking ahead to 2029, the model proposes a projected stock value of $678.6, translating into annual returns of 12.9%. This reinforces the notion that Microsoft remains an attractive investment, poised for sustained growth in the foreseeable future.
Risks to Thesis
Microsoft is primarily susceptible to macroeconomic factors, given its expansive global operations and substantial size. The company’s vulnerability lies in the potential impact of a market deceleration or recession. This concern is particularly pertinent as the optimistic upside suggested by the second discounted cash flow [DCF] model, with a 14.1% increase from the current stock price, could face challenges amid economic downturns.
A second risk factor involves venturing into precarious direct-to-consumer initiatives. Historical examples, such as Microsoft’s foray into the cellphone market and the development of Windows Mobile, underscore the potential pitfalls of such endeavors. Additionally, costly acquisitions, if proven unsuccessful, pose a risk to the company’s overall stability.
Notably, the models presented highlight a noteworthy aspect that could propel the stock’s fair price higher – capital expenditures (CapEx). As demonstrated, CapEx is intricately linked to revenue growth. In the second model, for instance, Microsoft could potentially incur a substantial CapEx of $66.8 billion by 2029. However, scrutiny of the table below reveals that CapEx has outpaced revenue at a faster annual pace during the 2018-2023 period. Despite this, should Microsoft choose to moderate its CapEx expenditures compared to the projected figures, the potential upside could surge, reaching up to 22%. This underscores the dynamic nature of the company’s financial landscape and the influence of strategic decisions on its valuation.
| Total | Annual Growth % | CapEx | Annual Growth % | |
| 2018 | 110,372 | 11632 | ||
| 2019 | 125,859 | 14.03% | 13,925 | 19.71% |
| 2020 | 143,020 | 13.64% | 15,441 | 10.89% |
| 2021 | 168,090 | 17.53% | 20,622 | 33.55% |
| 2022 | 198,270 | 17.95% | 23,886 | 15.83% |
| 2023 | 211,910 | 6.88% | 28,107 | 17.67% |
| 14.01% | 19.53% |
Conclusion
In conclusion, the decision to downgrade Microsoft to a “buy” rating is rooted in the comprehensive assessment of both discounted cash flow [DCF] models, which collectively failed to yield an “undervalued” result. While the first model, grounded in current analyst estimates, hinted at a potential slight overvaluation, the second model, incorporating segment-based projections, provided a more optimistic outlook with a fair price of $436.9, reflecting a 14.1% upside. However, the overarching theme is the absence of a conclusive undervaluation, prompting a more cautious investment stance. This nuanced evaluation underscores the intricacies of Microsoft’s valuation and the need for a discerning approach amid the evolving dynamics of the market and the company’s strategic initiatives.
Credit: Source link