

bodnarchuk
Introduction
The Toronto-based McEwen Mining Inc. (NYSE:MUX) released its second quarter 2023 results on May 8, 2023.
Also, on October 11, 2023, McEwen Mining Inc. announced a binding agreement for an additional $10.0 million investment by Nuton LLC, a Rio Tinto Venture and existing McEwen Copper shareholder.
After closing, Nuton will own 14.5% of McEwen Copper on a fully diluted basis, and McEwen Mining will own 47.7%.
Note: This article updates my July 24, 2023 article. I have followed MUX on Seeking Alpha since July 2021.
1 – 2Q23 Results Snapshot
McEwen Mining operates three gold and silver-producing mines and one development Project in Mexico.
Also, the company owns a subsidiary called McEwen Copper (47.7%) after the closing of Nuton LLC. Recent transaction indicated above.
MUX Map Assets (MUX Presentation)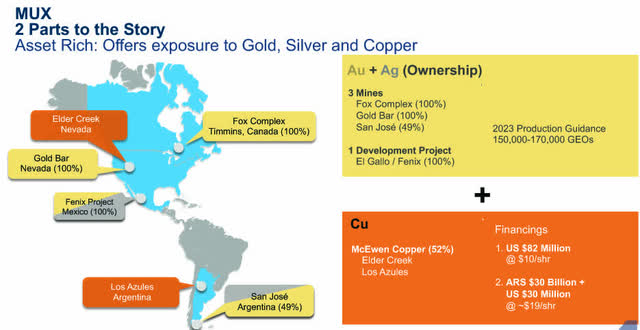
McEwen Mining posted a second-quarter loss of $21.63 million or $0.46 per diluted share, compared to a loss of $12.45 million or $0.26 per share in 1Q22.
Revenues were $34.40 million, up from $30.65 million in 2Q22 and unchanged sequentially. Finally, the 2Q23 generic free cash flow from operations was a negative $29.16 million, compared to a negative $40.92 million in 2Q22.
MUX produced 35,625 GEOs in 2Q23, including production from the San José mine.
MUX Quarterly Gold Equivalent per Mine 2Q22 versus 2Q23 (Fun Trading)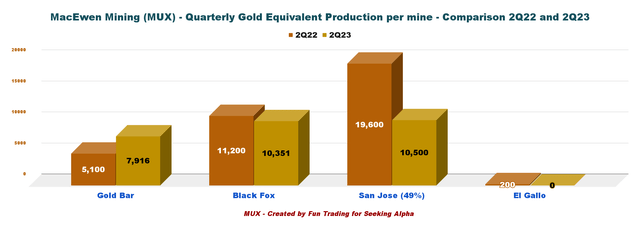
As many of you are aware, our gold and silver assets had a weak start for the year. While activities at McEwan Copper’s Los Azules project we’re running at a rapid pace. I’m pleased to say that our mines delivered better results in Q2 than Q1 and the outlook for the second half of the year is significantly better.
2 – Investment Thesis
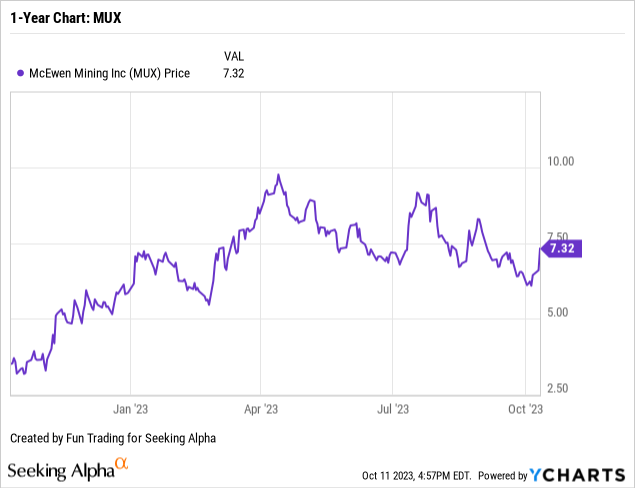
McEwen Mining had a terrible year in 2022 that culminated in July 2022 with a painful reverse split 1:10 to avoid delisting and a record-low stock price in October 2022. MUX recovered exceptionally well from this dire situation and is now up 109% on a one-year basis.
3 – The Los Azules Project in Argentina is Advancing
One important topic regarding MUX is its main copper project, the Los Azules in Argentina. A critical catalyst for the company is its copper subsidiary, McEwen Copper. The project is amongst the world’s largest copper deposits.
The company has invested $130 million in exploration since 2021 and secured two key strategy partners/sponsors, Rio Tinto and Stellantis.
Note: McEwen Mining released the PEA for Los Azules in June 2023.
MUX now owns a 47.7% interest in McEwen Copper Inc., which holds a 100% interest in the Los Azules copper project in San Juan, Argentina, and the early-stage Elder Creek exploration project in Nevada, USA.
It is a critical project for MUX shareholders, offering significant growth potential. It is an excellent copper project with an initial CapEx between $2.153 billion and $2,462 billion.
MUX PEA Los Azules (MUX Presentation)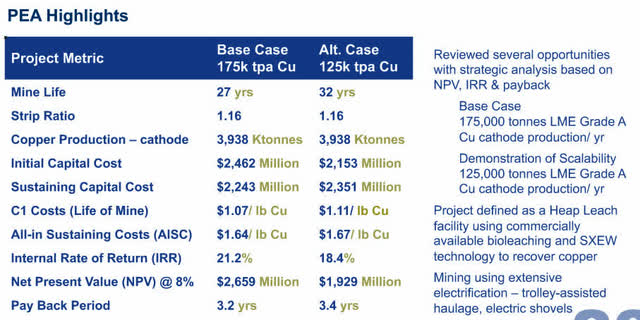
Thus, trading short-term MUX LIFO (about 75%) and keeping only a medium core position long-term is recommended.
4 – Stock Performance
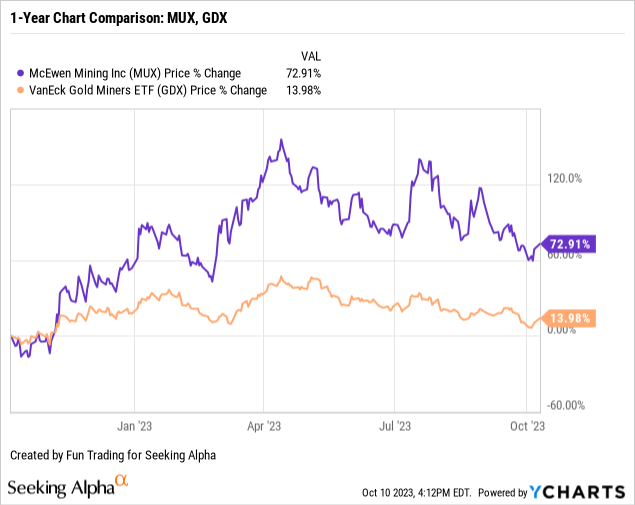
MUX is up a whopping 73% after a recovery from its lows in October 2022. MUX has significantly outperformed the VanEck Vectors Gold Miners ETF (GDX).
MUX – Financial Snapshot History Ending 2Q23: The Raw Numbers
Note: Numbers are indicated in US$.
| MUX | 2Q22 | 3Q22 | 4Q22 | 1Q23 | 2Q23 |
| Total Revenues $ million | 30.65 | 25.99 | 28.24 | 34.75 | 34.40 |
| Quarterly Earnings in $ million | -12.45 | -10.53 | -37.36 | -43.08 | -21.63 |
| EBITDA $ million | -6.88 | -4.58 | -24.88 | -32.11 | -33.58 |
| EPS (diluted) $ Per Share | -0.26 | -0.21 | -0.80 | -0.91 | -0.46 |
| Operating Cash Flow $ million | -28.74 | -6.20 | -8.06 | -28.61 | -25.15 |
| CapEx in $ | 4.21 | 8.89 | 7.05 | 4.95 | 4.01 |
| Free Cash Flow | -32.94 | -15.09 | -15.10 | -33.56 | -29.16 |
| Total Cash in $ million | 46.42 | 56.31 | 40.92 | 192.21 | 114.01 |
| Total LT Debt in $ million | 63.69 | 63.83 | 63.98 | 64.12 | 40.00 |
| Shares Outstanding (diluted) | 47.43 | 50.78 | 45.05 | 47.43 | 47.43 |
| Gold and Silver Production | 2Q22 | 3Q22 | 4Q22 | 1Q23 | 2Q23 |
| Quarterly Gold Equivalent Oz GEOs | 36,100 | 35,653 | 37,279 | 30,397 | 35,625 |
| Quarterly Au Production Oz | 27,600 | 26,200 | 28,970 | 25,900 | 28,700 |
| Quarterly Silver Production Oz | 704.600 | 853.000 | 702,000 | 381,200 | 571,210 |
Source: Company 10-Q filing.
McEwen Mining – Gold Production and Balance Sheet Details
1 – Revenues and Trends. Revenues were $34.40 million in 2Q23
MUX Quarterly Revenue History (Fun Trading) The second-quarter revenues were $34.40 million, up from $30.65 million in the same quarter a year ago. Net loss was $21.63 million, or $0.46 per diluted share. Adjusted loss was $13.0 million or $0.27 per share, compared to a loss of $1.9 million or $0.04 per share in 2Q22. This was driven by an investment of $28.5 million in our Los Azules project to complete our 2022-2023 drilling program and publish our updated PEA, which we expensed under US GAAP. As we progress towards feasibility at Los Azules, we expect to continue to report losses until we meet the US GAAP requirements for capitalization, which typically require a feasibility study establishing a mineral reserve estimate and permitting. Cash from operations was a loss of $25.15 million in 2Q23.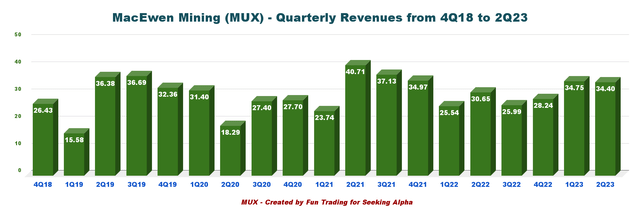
2 – Free cash flow was negative $29.16 million in 2Q23
MUX Quarterly Free Cash Flow History (Fun Trading) Note: Generic free cash flow is the cash from operations minus CapEx. It may differ from the company calculation.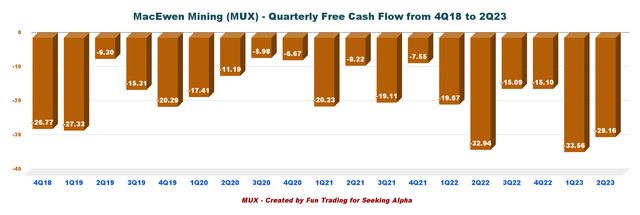
Trailing 12-month free cash flow TTM was negative $84.93 million, and the free cash flow for the second quarter was negative $29.16 million.
3 – Debt situation and the Los Azules copper project
MUX Quarterly Cash versus Debt History (Fun Trading) The total cash, including investment, was $114.01 million at the end of June 2023. Long-term debt is down to $40 million. The company retired early $25 million or 39% of its outstanding debt in 2Q23.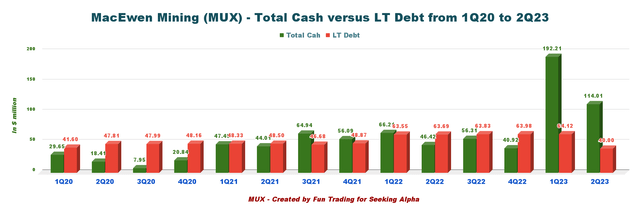
4 – Gold Equivalent production details. The company produced 35,625 GEOs in 2Q23
4.1 – Production in GEOs
MUX Quarterly Gold Equivalent Production History (Fun Trading) Gold Equivalent production was 35,625 Au Eq. Oz, down slightly from 36,218 Au Eq. Oz in 2Q22.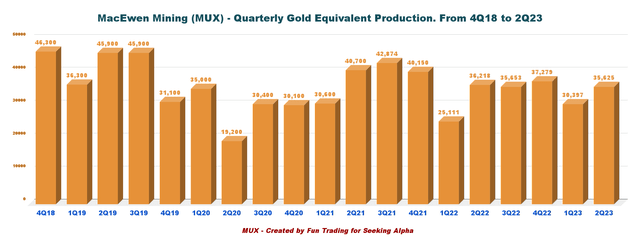
4.2 – Gold Production details per mine:
Gold production was 28,700 Au ounces in 2Q23.
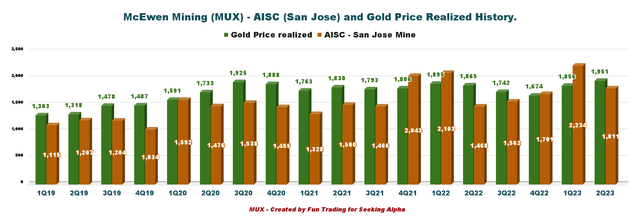
MUX Quarterly Gold Production per Mine History (Fun Trading) 4.3 – All-in Sustaining costs – AISC and gold price received for 2Q23 MUX Quarterly AISC San Jose and Gold Price History (Fun Trading) AISC at the San Jose mine was $1,811 per ounce in 2Q23.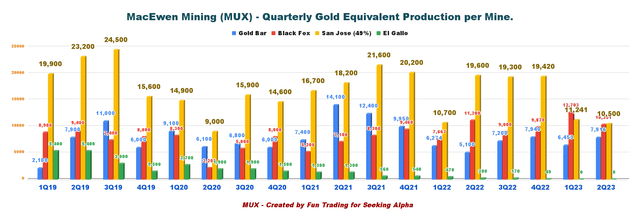
5 – 2023 Guidance
For 2023, MUX expects a 2023 production of 150K-170K GEOs.
MUX 2023 Guidance (MUX Presentation)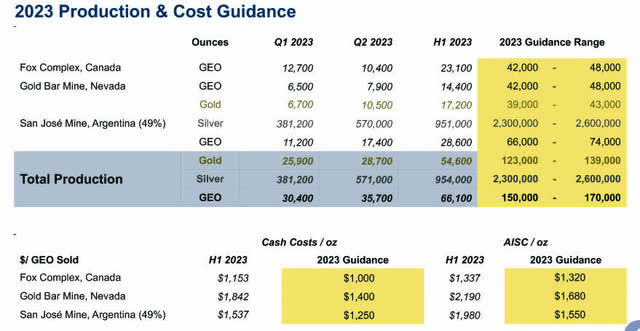
Technical Analysis (Short Term) and Commentary
MUX TA Chart (Fun Trading StockCharts)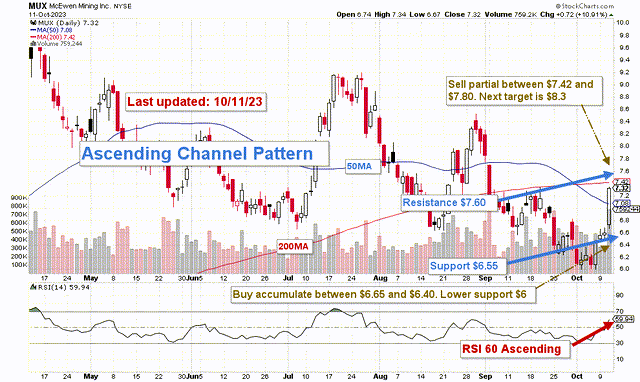
MUX forms an ascending channel pattern, with resistance at $7.60 and support at $6.55. The RSI is now 60 and elevated, reinforcing that MUX is about to reach a resistance of $7.60.
Ascending channel patterns or rising channels are short-term bullish in that a stock moves higher within an ascending channel, but these patterns often form within longer-term downtrends as continuation patterns. The ascending channel pattern is often followed by lower prices, but only after a downside penetration of the lower trend line.
I suggest selling LIFO about 75% of your position between $7.42 and $7.80 with higher resistance at $8.30 and accumulating on any weakness between $6.65 and $6.40 with possible lower support at $6.00.
The strategy buy-sell-rinse-repeat is the best path for this stock, only keeping a small/medium long-term position you have de-risked with your short-term gains.
Warning: The TA chart must be updated frequently to be relevant. It is what I am doing in my stock tracker. The chart above has a possible validity of about a week. Remember, the TA chart is a tool only to help you adopt the right strategy. It is not a way to foresee the future. No one and nothing can.
Credit: Source link