
Getty Images
Dear Partners and Friends,
The full-year 2025 return of Maran Partners Fund was +5.4%, net of all fees and expenses, following a fourth quarter return of -5.2%, net.1 While this rocky fourth quarter capped a frustrating year, our long-term results remain solid.
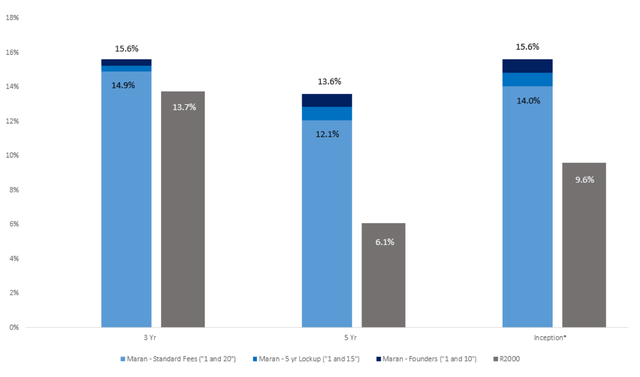
Our annualized gross alpha since inception vs. the Russell 2000 is approximately 10%. In the last decade, we had one down year, two years in which our returns were up in the single digits, and seven years with returns in the double digits. While I can’t offer any guesses about the distribution of our future returns, I can promise they will remain lumpy. Our concentrated approach guarantees that. We remain focused on the long term. Over this time horizon, our strategy has demonstrated its efficacy in generating solid returns while being invested in companies that are typically inexpensive well-run, with little to no leverage, and outside of those that dominate the indices.2
We remain concentrated on what I believe are our top ideas while managing risk and exposure in what I believe are appropriate ways. Approximately two thirds of our capital is invested in our top five positions, but we have no position that represents more than 15% of capital. Our average net exposure in 2025 was 83%, slightly above our long-term average of 78%.
We had six stocks among our top five positions at various times throughout last year. The current top five holdings3 are Clarus Corp (CLAR), Correios de Portugal (Euronext Lisbon: CTT) (CTTOF), Horizon Kinetics Holding Corporation (HKHC), Pure Cycle Corporation (PCYO), a newly disclosed top-five position, more on which below), and Turning Point Brands (TPB); APi Group (APG) is currently a close sixth.
The approximate returns of these stocks in 2025 were:
As you can see, a number of our core positions performed well last year. Unfortunately, two of our largest—Clarus and Horizon Kinetics—experienced meaningful declines.
As always, I frequently re-underwrite and update my theses on our holdings. In this letter, I review our top five positions and hope to give you a sense of why we own them and why I remain optimistic about them. I believe our portfolio is very asymmetric, with a highly favorable reward/risk ratio.
Clarus Corp (CLAR)
As most of you know, we have a long history with Clarus Corp. We first invested in the company in late 2015, building a position in the $4-5 per share range. We added more over the years as the business grew but sold approximately 80% of our position in the summer of 2022 at around $26-27 per share (yes, hindsight is 20/20; we should have sold it all). We reacquired a large position over the last few years as the stock round-tripped. We started buying the stock back too soon but have averaged down. We currently own just under 5% of the company at an average cost of approximately $4 per share.
Clarus’ results have been tepid following the Covid-era boom in outdoor activities, but it has still generated generally positive adjusted EBITDA over the last few years. While the results have been below what I—and the company—believe are possible for the brands, the stock market has taken these results and penalized the stock dramatically more than I think is reasonable. I thought the stock was cheap at $5 per share and at $4 per share, and I still certainly think it is in the $3s.
Clarus ended 2025 at $3.35/sh. It has 38.4 million shares outstanding, so its market capitalization was approximately $130 million. I think Clarus ended the year with around $35-40 million of net cash on its balance sheet, so its enterprise value was approximately $90-95 million (the company has essentially no debt). What are shareholders getting for this price? Clarus’ two primary brands, Black Diamond Equipment (“BD”) and Rhino Rack (“Rhino”), which are generating around $175 million and $75 million of annual revenue, respectively.
In other words, Clarus is trading for about 0.35x its annual revenue. I think these brands are worth at least 1x their revenue, if not substantially more. Even at 1x trailing revenue, Clarus would be valued at $7.50 per share.
While trading at a cheap valuation on a sum-of-the-parts basis is noteworthy, what makes Clarus particularly interesting right now is that it appears catalysts are approaching. Clarus stated in its 3Q 2025 earnings press release:
As we look toward the future, we are focused on unlocking the intrinsic value at each of the Outdoor and Adventure segments, especially as we consider the disconnect between the sum of the parts value of our two segments and today’s market valuation.
My interpretation of this corporate speak: Clarus is seeking to sell both of its brands to unlock and maximize shareholder value. If it does, and if it gets the valuation I believe it warrants, its stock price could more than double. Patience has been required over the last few years (as it was with Turning Point Brands in 2022-2024, more on which below), but I believe it will ultimately be rewarded.
I’m comfortable being patient for a number of reasons, key of which are the fact that Clarus has a net cash balance sheet, is generating EBITDA, and has an aligned owner-operator at the helm (who owns approximately 18% of the company and added to his holdings over the last year). The fact that the company has announced it is seeking to “unlock intrinsic value” is a clear indication that it agrees with, and is doing something about, my view that the stock is undervalued.
Horizon Kinetics5(HKHC)
Horizon Kinetics appreciated over 400% from December 1, 2023, to year-end 2024, but then sold off by approximately one-third in 2025. HKHC is an illiquid stock, and it doesn’t take much trading volume to move the price. It seems as if, following the registration of the shares of some long-time shareholders (dating to when HKHC was still a private company), one or more of these shareholders started selling aggressively in the second half of last year, driving the price down. This type of volatility shouldn’t worry us and will work itself out over time.
When it comes to what really matters—the fundamentals—HKHC is executing well and gives us exposure to a number of “inflation beneficiary” themes. Many of HKHC’s largest investments are in energy and precious metals royalties, real estate, mineral rights, water rights, and other inflation beneficiaries such as exchanges.
HKHC shareholders get exposure to these investments in three ways: 1) investments held directly by HKHC on its balance sheet; 2) HKHC’s core asset management business, which has approximately $10 billion of assets under management (AUM) primarily invested in these same themes; and 3) future incentive fees, or “carry,” from the company’s private funds (which span venture capital, private equity, and hedge funds).
As of 9/30/2025, Horizon had cash and investments on its balance sheet of approximately $384 million6, or $20.63 per share. It had $10.4 billion of regulatory assets under management, on which it generated $16.1 million of operating income7 (excluding accrued incentive fees) through the first nine months of 2025 (which is $21.5 million, or $1.15 per share, annualized).
As for the third bucket, there is no guarantee that any of the company’s private funds will generate future incentive fees or carry. That said, this is a potentially meaningful source of value and cash flow for HKHC’s shareholders, albeit one that is likely to be lumpy. In some years, incentive fees could be zero, but in an especially good year, such as 2024, for example, incentive fees were $51.7 million, or $2.77 per share.8
Murray Stahl, HKHC’s CEO, spoke about one such private investment that could generate incentive fees on the company’s 2Q 2025 conference call.
We have a long-standing investment in some funds related to Miami International Holdings, a private company. And you might be aware that about a week ago, the company launched its initial public offering. That’s a transformative transaction. And it’s a, I would say, a seminal event.
MIAX is…doing splendidly, and it’s worth paying attention to. If things go as they continue to go—no guarantee of that, of course—it will have some very positive implications for [HKHC’s] income.
Horizon Kinetics recently released a 2026 New Year’s letter from its founders, in which it discussed its value investment philosophy and the role of private investments in it. This enjoyable read sheds light on some of HKHC’s growth drivers. What is good for the investors in HKHC’s funds is likely good for holders of the parent company (i.e., publicly traded HKHC).
Horizon Kinetics: 2026 New Year Letter from the Founders
I’ll leave it to intrepid readers to do their own back-of-the-envelope valuation exercises on HKHC (using the three buckets of value I outlined above or other methods), but I’ll simply conclude by saying that I’m excited by the company’s prospects over the coming years.
Pure Cycle Corporation (PCYO)
We have owned shares in Pure Cycle for over five years and meaningfully increased our position in 2025. Between our main fund and our SPVs, we own just under 15% of the company.
Pure Cycle is a Colorado-based real estate developer and water company. It is developing over 900 acres in the suburbs of the Denver metro area and holds approximately 30,000 acre-feet of water rights in the region. The company has a strong, net-cash balance sheet. PCYO is another “inflation beneficiary” holding given the long-lived, hard asset nature of its assets.
I recently joined the Board of Directors of Pure Cycle and was appointed chair of a newly formed Strategy and Capital Allocation Committee. The press release announcing this can be read here:
Pure Cycle Corporation Appoints Daniel J. Roller to its Board of Directors
As you might have guessed, this role limits what I can share publicly on this investment at the moment, but you can expect that I will be working tirelessly to help Pure Cycle maximize its value for all of its shareholders.
Turning Point Brands (TPB)
I last wrote in depth about our TPB investment in our 2Q 2024 letter to partners. I encourage you to re-read that section of that letter, as it provides a good a priori framing of our thesis on the stock. Here are some excerpts:
TPB is trading at a high single-digit free cash flow yield (low teens on our cost basis [~$26]). Its core brands (Zig Zag and Stokers) should drive mid-single-digit growth in EBITDA. If the stock re-rates from just over 10 times free cash flow to the mid-teens over the next three years, that would add over 10 percentage points per year to the expected return. These components (high single-digit starting yield, mid-single-digit growth, 10%+ from multiple expansion) should therefore drive an expected mid-20% return profile (the “three-year double” for which I like to underwrite).
If this were the whole thesis, it would be sufficient. But there is an additional source of meaningful upside that I believe the market does not yet appreciate. This is the company’s nicotine pouch product called FRE.
TPB should generate $3.50-4.00 of normalized free cash flow per share next year, and over $5.00 by 2027. If it trades at a 15-18x multiple, that would put its value at $75-90 per share in a few years, and there is no reason to think that TPB can’t continue to compound from there (that is, if it isn’t bought out by one of the tobacco majors first).
The profile of our investment in TPB is similar to many of my prior favorites. I believe that we have limited risk of permanent capital loss; a core business that can drive excellent performance on its own; and an additional asymmetric source of potentially meaningful upside. If FRE disappoints, our investment in TPB should still be solid. If FRE is a real winner, though, then watch out.
Fast forward 18 months, and the thesis has played out and then some. We were right for many of the right reasons. The nicotine pouch market has exploded, driving dramatic growth in TPB’s business. TPB initially guided 2025 nicotine pouch sales to $60-80 million, then raised that to $80-95 million in March, $100-110 million in August, and $125-130 million in November. Who said “value” investors don’t like growth?
TPB could generate over $5.00 per share in earnings this year (a year ahead of schedule) and $6.00+ next year as the market continues to grow and as TPB moves from outsourced, overseas sourcing to insourced, domestic production. The “Wall Street” consensus for earnings is just $4.15 per share this year.
TPB is a prime example of why we don’t utilize a price target-driven approach. When we were buying the stock for $25+ in the spring of 2024, we thought it could fit our underwriting profile of being a “three-year double.” But we didn’t exit the position when it got to $50 or even $55 per share. Instead, we continued to update our thesis and re-underwrite the company in real time.
We continue to do so. While TPB’s P/E multiple has expanded from the single digits to the low-20s, we believe this is warranted given the company’s acceleration. Still, the fact that more “growth” investors now hold the stock could mean we have to withstand greater volatility in the shares. Despite that, the company’s long-term potential remains very high.
Looking out a few years, if TPB can garner 8% market share (similar to what its Stokers brand has) in a $12bn+ nicotine pouch market, it would generate approximately $1bn in sales. This is a 30-40% EBITDA margin business at scale, so TPB could generate $350 million of EBITDA at the midpoint. This could be worth 12-15x EBITDA, or $4-5 billion in value. Adjusting for JVs and adding in the Stokers and Zig Zag brands (a “mere” ~$100 million of combined EBITDA), we think TPB could be worth $200-300 per share in the next few years. In other words, despite the strong performance to date, it still looks attractive.
I wrote above about the patience that Clarus has required over the last two years. Prior to the spring of 2024, TPB stock was itself drifting sideways in the $20s for two years—it had pretty much been left for dead by the markets. Of course, patience was ultimately rewarded. When risk of permanent capital loss seems limited and potential upside is highly asymmetric, investors can afford to be patient.
Correios de Portugal (Euronext Lisbon: CTT)
CTT is our European conglomerate that owns a pan-Iberian logistics business, a bank, and excess real estate that is being monetized.
CTT has compounded at approximately a 21% CAGR over our holding period dating back to 2019, but I believe it remains cheap and asymmetric. Despite excellent execution, growth, and capital allocation over a number of years, CTT has not been awarded a high valuation by the market. This is somewhat understandable, as CTT is listed in Portugal and is still off the beaten path.
CTT achieved its 2021-2025 goal of growing EBIT at a better than 15% CAGR. (I repeat: Who said “value” investors don’t like growth?) At its recent capital markets day, it guided for similar levels of EBIT growth to continue through 2028, which would take the Company’s EBIT from ~€100 million to €175-195 million (or €140 million excluding Banco CTT).
At 12x EBIT (or 7.5x EBITDA), the core logistics business would be worth approximately €1.7 billion by 2028. Banco CTT is likely worth another €400-500 million (10-12x EBIT or 1.3-1.5x book value), bringing the fair value of the company to €2.1-2.2 billion. On a base of 125 million shares (assuming moderate buybacks over the next three years), the company could be worth €17+ per share in 2028, which meets our underwriting criteria of a “three-year double” or better.
Near-term catalysts are abundant. The event path for CTT over the coming few quarters should include the announcement of the completion of the DHL JV, and then shortly thereafter, the implementation of the next share repurchase program. The announcement of the sale of Banco CTT could follow as soon as later this year.
Administrative Update
December statements have been released. I expect K-1 tax forms and annual audited financial statements to be completed and distributed before the regular tax filing deadline of April 15.
Conclusion
2025 was a momentous year for Maran Capital. We celebrated our 10th anniversary over the summer. Our assets under management (AUM) grew meaningfully, in both Maran Partners Fund (“MPF”) and our special purpose vehicles (SPVs), to a combined total of approximately $74 million. Welcome, new partners.
I continue to believe our current size is not an impediment to generating attractive returns and intend to close the fund if and when it becomes one. Our use of SPVs allows us to scale additional capital into ideas in which there is more capacity than MPF can take advantage of and in which we believe we can help tilt the odds of a good return in our favor.
While I think the maturation and growth of our firm should be viewed as positives for our partners, obviously what should matter most to you are the prospects for long-term risk-adjusted returns. I am optimistic as we enter 2026; I really like our portfolio and am excited about our prospects.
I am finalizing the details of our upcoming investor events. I expect to host events for partners and friends in each of Denver and New York City this summer. Keep an eye out for invitations in the coming months.
Our aligned limited partner base is a key competitive advantage. Thank you for your continued trust.
Sincerely,
Dan Roller
Original Post
Editor’s Note: The summary bullets for this article were chosen by Seeking Alpha editors.
Credit: Source link