

• bitcoinBitcoin(BTC)$78,561.002.36%
  • ethereumEthereum(ETH)$2,533.282.21%
  • tetherTether(USDT)$1.000.02%
  • binancecoinBNB(BNB)$722.050.83%
  • rippleXRP(XRP)$1.447.30%
  • usd-coinUSDC(USDC)$1.000.01%
  • solanaSolana(SOL)$102.812.85%
  • tronTRON(TRX)$0.338660-0.27%
  • Figure HelocFigure Heloc(FIGR_HELOC)$1.040.00%
  • zcashZcash(ZEC)$1,169.528.75%
  • HyperliquidHyperliquid(HYPE)$80.103.28%
  • dogecoinDogecoin(DOGE)$0.0840702.08%
  • RainRain(RAIN)$0.014336-5.53%
  • USDSUSDS(USDS)$1.000.01%
  • moneroMonero(XMR)$514.32-1.32%
  • whitebitWhiteBIT Coin(WBT)$81.362.20%
  • chainlinkChainlink(LINK)$11.583.50%
  • leo-tokenLEO Token(LEO)$9.00-0.48%
  • cardanoCardano(ADA)$0.2096833.39%
  • stellarStellar(XLM)$0.1937209.48%
  • Ethena USDeEthena USDe(USDE)$1.000.03%
  • daiDai(DAI)$1.000.02%
  • bitcoin-cashBitcoin Cash(BCH)$224.581.74%
  • USD1USD1(USD1)$1.000.01%
  • litecoinLitecoin(LTC)$53.37-0.49%
  • uniswapUniswap(UNI)$6.546.36%
  • CantonCanton(CC)$0.0976582.99%
  • the-open-networkGram (prev. Toncoin)(GRAM)$1.350.69%
  • hedera-hashgraphHedera(HBAR)$0.0776553.66%
  • avalanche-2Avalanche(AVAX)$7.624.31%
  • Global DollarGlobal Dollar(USDG)$1.000.02%
  • nearNEAR Protocol(NEAR)$2.508.12%
  • shiba-inuShiba Inu(SHIB)$0.0000052.53%
  • suiSui(SUI)$0.733.48%
  • crypto-com-chainCronos(CRO)$0.0595494.22%
  • paypal-usdPayPal USD(PYUSD)$1.000.02%
  • BlackRock USD Institutional Digital Liquidity FundBlackRock USD Institutional Digital Liquidity Fund(BUIDL)$1.000.00%
  • tether-goldTether Gold(XAUT)$4,298.01-0.86%
  • BittensorBittensor(TAO)$233.130.56%
  • Circle USYCCircle USYC(USYC)$1.140.01%
  • MemeCoreMemeCore(M)$1.09-4.36%
  • okbOKB(OKB)$113.701.46%
  • Ripple USDRipple USD(RLUSD)$1.000.01%
  • Ondo US Dollar YieldOndo US Dollar Yield(USDY)$1.150.09%
  • aaveAave(AAVE)$128.763.31%
  • AsterAster(ASTER)$0.702.57%
  • mantleMantle(MNT)$0.583.02%
  • pax-goldPAX Gold(PAXG)$4,302.20-0.84%
  • World Liberty FinancialWorld Liberty Financial(WLFI)$0.0578051.94%
  • OndoOndo(ONDO)$0.3571843.96%
TradePoint.io
  • Main
  • AI & Technology
  • Stock Charts
  • Market & News
  • Business
  • Finance Tips
  • Trade Tube
  • Blog
  • Shop
No Result
View All Result
TradePoint.io
No Result
View All Result

M2 Update – Still Looking Good

March 27, 2024
in Market & News
Reading Time: 5 mins read
A A
M2 Update – Still Looking Good
ShareShareShareShareShare

deepblue4you

Today, the Fed released the February money supply data, and there were no unwelcome surprises. M2 continues to shrink relative to the economy, and that’s the reason inflation is likely to continue to fall.

Chart #1
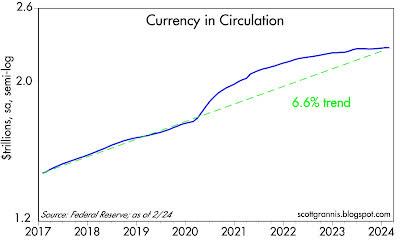
Currency in circulation

Chart #1 shows the recent history of currency in circulation, which represents about 10% of M2. It rose at a fairly constant 6.6% annual rate from 2010 until early 2020, then surged (as did M2) from March 2020 through early 2021.

I’ve assumed for years that this measure of the money supply is also a reliable measure of money demand, because people hold currency only if they want it.

(Important note: There is no direct measure of money demand, and that’s why it’s hard for the Fed to keep the supply of and the demand for money in balance.)

Any rational person with unwanted currency would simply return it to a bank in exchange for an interest-bearing deposit of one form or another.

So the message of currency is that the demand for money exploded in the wake of the Covid crisis; everyone wanted more cash because there was so much uncertainty.

And besides, it wasn’t easy to spend money back then if you couldn’t leave your home. But things started changing in early 2021 with the introduction of vaccines.

Life slowly started getting back to normal. The demand for money began to subside. Today, currency in circulation has fully reversed its “bulge,” and is back on its 6.6% annual growth track.

Most important is the fact that if money supply and money demand are now roughly in balance, as seems to be the case, there is no reason to expect a meaningful change in inflation.

Chart #2
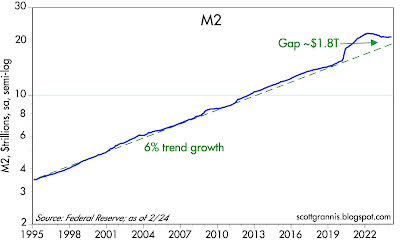
M2

M2 grew at a 6% annual rate from 1995 through 2019. It then surged by some $6 trillion over the next two years, propelled by $6 trillion of government “stimulus” spending which was monetized.

Deficit spending at all other times in recent history has been financed by selling Treasury debt. Not so this time, when the spending was effectively financed by newly-printed money.

The initial surge in M2 was not inflationary because, as currency in circulation tells us, the demand for M2 was intense in the first year of soaring M2.

But as the demand for money began to decline in 2021, excess money became inflationary as people began spending their surplus cash.

This, coupled with supply bottlenecks, created a classic “demand-pull” inflation: too much money chasing too few goods.

M2 growth since early 2022 has been flat to negative, thanks in large part to the Fed’s belated decision to jack up interest rates. Higher interest rates made M2 money more attractive, effectively neutralizing in large part the huge excess of M2 at the time.

Although there is still some “excess” money according to this chart, it is not a source of inflation because interest rates remain high: extra money supply is countered by the extra demand for money that results from high interest rates.

Chart #3
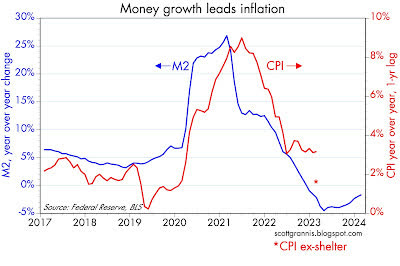
Money growth leads inflation

Chart #3 illustrates how changes in M2 growth tend to precede changes in the CPI by about one year. That relationship appears to have broken down over the past 6-8 months, however.

I think the reason for that is that the CPI is being overstated by the way the BLS calculates shelter costs.

YOU MAY ALSO LIKE

More Iran War Strikes, Higher Oil Prices; Why an Algorithm is Cutting Disability Benefits | Sept. 9

Dire warning that A.I. could end humanity

The red asterisk shows the year-over-year change in the CPI ex-shelter (1.8%) as of February ’24; that’s much more in line with the growth of M2.

And it further suggests we have continued disinflation in the pipeline since shelter costs are almost surely going to decline over the next 6-8 months.

Chart #4
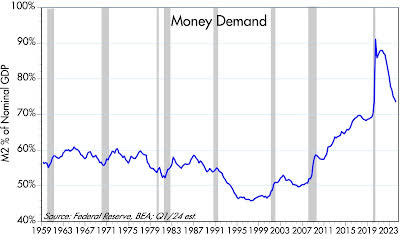
Money demand

Chart #4 shows another way of calculating the demand for money. It is simply the ratio of M2 to nominal GDP. You can think of it as a measure of how much of one’s annual income one wants to hold in the form of money (cash, and cash equivalents).

Here it is easy to see the sudden and tremendous surge in money demand in the early months of the Covid crisis. Then, starting about a year later, we see money demand plunging.

At the current rate it should return to pre-Covid levels over the next year or so. We’re almost out of the Covid woods, in other words.

Many will call this a “soft landing” or “no-landing” scenario. Because it will be the first time the Fed has wrestled inflation down from uncomfortably high levels without also triggering a recession.

And the reason for that is the Fed’s “abundant reserves” policy, which avoids creating a shortage of liquidity in the banking system.

Original Post

Editor’s Note: The summary bullets for this article were chosen by Seeking Alpha editors.

Credit: Source link

ShareTweetSendSharePin

Related Posts

More Iran War Strikes, Higher Oil Prices; Why an Algorithm is Cutting Disability Benefits | Sept. 9
Market & News

More Iran War Strikes, Higher Oil Prices; Why an Algorithm is Cutting Disability Benefits | Sept. 9

September 14, 2026
Dire warning that A.I. could end humanity
Market & News

Dire warning that A.I. could end humanity

September 14, 2026
Trump says Iran war will end ‘after the election’
Market & News

Trump says Iran war will end ‘after the election’

September 14, 2026
Apple unveils foldable iPhone
Market & News

Apple unveils foldable iPhone

September 14, 2026
Next Post
Frontline Ventures Backs US, Europe Software Expansion

Frontline Ventures Backs US, Europe Software Expansion

Leave a Reply Cancel reply

Your email address will not be published. Required fields are marked *

Search

No Result
View All Result
Trump says a united Ireland will happen

Trump says a united Ireland will happen

September 12, 2026
Fans cheer for Celine Dion hours before concert return

Fans cheer for Celine Dion hours before concert return

September 12, 2026
Salesforce Debuts Job-Ready Agentforce Agents and Long-Horizon Runtime – Unite.AI

Salesforce Debuts Job-Ready Agentforce Agents and Long-Horizon Runtime – Unite.AI

September 11, 2026

About

Learn more

Our Services

Legal

Privacy Policy

Terms of Use

Bloggers

Learn more

Article Links

Contact

Advertise

Ask us anything

©2020- TradePoint.io - All rights reserved!

Tradepoint.io, being just a publishing and technology platform, is not a registered broker-dealer or investment adviser. So we do not provide investment advice. Rather, brokerage services are provided to clients of Tradepoint.io by independent SEC-registered broker-dealers and members of FINRA/SIPC. Every form of investing carries some risk and past performance is not a guarantee of future results. “Tradepoint.io“, “Instant Investing” and “My Trading Tools” are registered trademarks of Apperbuild, LLC.

This website is operated by Apperbuild, LLC. We have no link to any brokerage firm and we do not provide investment advice. Every information and resource we provide is solely for the education of our readers. © 2020 Apperbuild, LLC. All rights reserved.

No Result
View All Result
  • Main
  • AI & Technology
  • Stock Charts
  • Market & News
  • Business
  • Finance Tips
  • Trade Tube
  • Blog
  • Shop

© 2023 - TradePoint.io - All Rights Reserved!