

Dilok Klaisataporn/iStock via Getty Images
ProShares Direxion Daily S&P 500 Bull 3x Shares ETF (NYSEARCA:SPXL) is one of the most popular instruments to trade in bullish market conditions. It is equivalent to ProShares UltraPro S&P 500 ETF 3x Shares (UPRO). The daily 3X leverage factor is a source of drift, which may be positive or negative. It must be closely monitored to detect changes in the drift regime. This article explains what “drift” means, quantifies it in 22 leveraged ETFs, and comments historical data on SPXL.
Why do leveraged ETFs drift?
Leveraged ETFs often underperform their underlying index leveraged by the same factor. ETF decay may come from four factors: beta-slippage, roll yield, tracking errors, management costs. Beta-slippage is the main factor in equity leveraged ETFs. To understand it, imagine a very volatile asset that goes up 25% one day and down 20% the day after. A perfect 2x leveraged ETF goes up 50% the first day and down 40% the second day. On the close of the second day, the underlying asset is back to its initial price:
(1 + 0.25) x (1 – 0.2) = 1
In the same time, the perfect leveraged ETF has lost 10%:
(1 + 0.5) x (1 – 0.4) = 0.9
It is the normal effect of leveraging and rebalancing. In a trending market, beta-slippage can be positive. If the underlying index goes up 10% two days in a row, on the second day, it is up 21%:
(1 + 0.1) * (1 + 0.1) = 1.21
The perfect 2x leveraged ETFs is up 44%:
(1 + 0.2) * (1 + 0.2) = 1.44
Moreover, beta-slippage is path-dependent. If the underlying index gains 50% on day 1 and loses 33.33% on day 2, it is back to its initial value, like in the first example. However, the 2x ETF loses one third of its value, instead of 10% in the first case:
(1 + 1) x (1 – 0.6667) = 0.6667
Without a demonstration, it shows that the higher the volatility, the higher the decay.
Monthly and yearly drift watchlist
There is no standard definition for the drift of a leveraged ETF. Mine is based on the difference between the leveraged ETF performance and Ñ times the performance of the underlying index on a given time interval, if Ñ is the leveraging factor. Most of the time, this factor defines a daily objective relative to an underlying index. However, some dividend-oriented leveraged products have been defined with a monthly objective (mostly defunct ETNs: CEFL, BDCL, SDYL, MLPQ, MORL…).
First, let’s start by defining “Return”: it is the return of a leveraged ETF in a given time interval, including dividends. “IndexReturn” is the return of a non-leveraged ETF on the same underlying asset in the same time interval, including dividends. “Abs” is the absolute value operator. “Drift” is calculated as follows:
Drift = (Return – (IndexReturn x Ñ))/ Abs(Ñ)
“Decay” means negative drift.
|
Index |
Ñ |
Ticker |
1-month Return |
1-month Drift |
1-year Return |
1-year Drift |
|
S&P 500 |
1 |
SPY |
5.40% |
0.00% |
28.04% |
0.00% |
|
2 |
SSO |
10.34% |
-0.23% |
51.03% |
-2.53% |
|
|
-2 |
SDS |
-9.09% |
0.86% |
-32.15% |
11.97% |
|
|
3 |
SPXL |
15.60% |
-0.20% |
77.34% |
-2.26% |
|
|
-3 |
SPXU |
-13.44% |
0.92% |
-46.42% |
12.57% |
|
|
ICE US20+ Tbond |
1 |
TLT |
2.13% |
0.00% |
-8.85% |
0.00% |
|
3 |
TMF |
4.99% |
-0.47% |
-38.80% |
-4.08% |
|
|
-3 |
TMV |
-5.12% |
0.42% |
36.18% |
3.21% |
|
|
NASDAQ 100 |
1 |
QQQ |
6.92% |
0.00% |
30.38% |
0.00% |
|
3 |
TQQQ |
21.18% |
0.14% |
82.60% |
-2.85% |
|
|
-3 |
SQQQ |
-18.00% |
0.92% |
-53.54% |
12.53% |
|
|
DJ 30 |
1 |
DIA |
2.43% |
0.00% |
19.80% |
0.00% |
|
3 |
UDOW |
5.99% |
-0.43% |
46.33% |
-4.36% |
|
|
-3 |
SDOW |
-6.04% |
0.42% |
-33.49% |
8.64% |
|
|
Russell 2000 |
1 |
IWM |
4.82% |
0.00% |
20.04% |
0.00% |
|
3 |
TNA |
13.11% |
-0.45% |
36.45% |
-7.89% |
|
|
-3 |
TZA |
-12.57% |
0.63% |
-44.70% |
5.14% |
|
|
MSCI Emerging |
1 |
EEM |
1.85% |
0.00% |
12.37% |
0.00% |
|
3 |
EDC |
4.32% |
-0.41% |
16.84% |
-6.76% |
|
|
-3 |
EDZ |
-4.83% |
0.24% |
-24.04% |
4.36% |
|
|
Gold spot |
1 |
GLD |
0.71% |
0.00% |
18.09% |
0.00% |
|
2 |
UGL |
0.53% |
-0.45% |
26.62% |
-4.78% |
|
|
-2 |
GLL |
-0.76% |
0.33% |
-21.42% |
7.38% |
|
|
Silver spot |
1 |
SLV |
14.38% |
0.00% |
28.46% |
0.00% |
|
2 |
AGQ |
28.39% |
-0.19% |
41.79% |
-7.57% |
|
|
-2 |
ZSL |
-25.66% |
1.55% |
-44.39% |
6.27% |
|
|
S&P Biotech Select |
1 |
XBI |
2.06% |
0.00% |
6.23% |
0.00% |
|
3 |
LABU |
3.49% |
-0.90% |
-16.81% |
-11.83% |
|
|
-3 |
LABD |
-6.09% |
0.03% |
-37.79% |
-6.37% |
|
|
PHLX Semicond. |
1 |
SOXX |
13.18% |
0.00% |
48.44% |
0.00% |
|
3 |
SOXL |
41.37% |
0.61% |
131.19% |
-4.71% |
|
|
-3 |
SOXS |
-31.54% |
2.67% |
-76.40% |
22.97% |
The leveraged bull biotechnology ETF (LABU) has the worst monthly and annual decays: -0.90% and -11.83%, respectively. The leveraged bear semiconductors ETF (SOXS) has the highest monthly and annual positive drift: +2.67% and +22.97%, in a large loss.
Positive drift comes with a steady trend in the underlying asset, whatever the trend direction and the ETF direction. It means positive drift may come with a gain or a loss for the ETF. Negative drift comes with daily return volatility (“whipsaw”). Whipsaw happens more often in downtrends of the underlying asset.
SPXL drift history
In the table above, SPXL is in mild negative drift for both time frames. The next chart plots its 12-month drift since inception (11/05/2008). The 12 months of data prior to inception used for the calculation are synthetic prices calculated from S&P 500 daily returns.
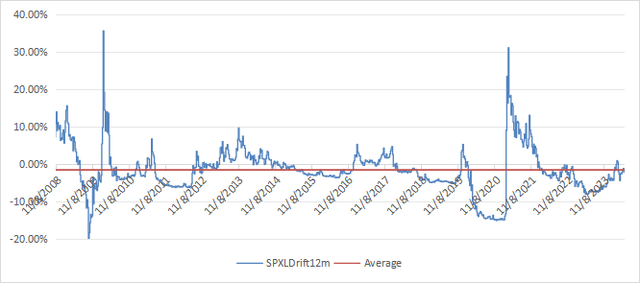
12-month drift of SPXL since inception. (Chart: author; data: Portfolio123)
The average 12-month drift in this time frame is negative: -1.63%. SPXL has suffered a decay since it was launched, but the drift was dwarfed by the bullish trend: its total return is 3813% (26.55% annualized).
The drift fell in negative territory in the March 2020 meltdown. It jumped to +31% in April 2021 after the stock market had one of its strongest rallies in history, leading to a high positive slippage. While SPY returned about 39% in one year, SPXL went up 162%. It is about four times the underlying index return, showing the good side of beta-slippage in a bullish trend. Then, SPXL price action became scary between 3/1/2022 and 3/1/2023: it has lost about 36% while SPY was down 6.7%, with an apparent leveraging factor close to 6 in this time frame!
Simulated performance starting in January 2000 is concerning. In this period, including two bear markets, SPXL annualized return would have been inferior to the non leveraged index (4.36% vs 7.34% for SPY), with a maximum drawdown of -98%. This is a strong warning against a buy-and-hold strategy! The next chart plots the hypothetical 12-month drift starting in January 2000. The average is -2.14%.
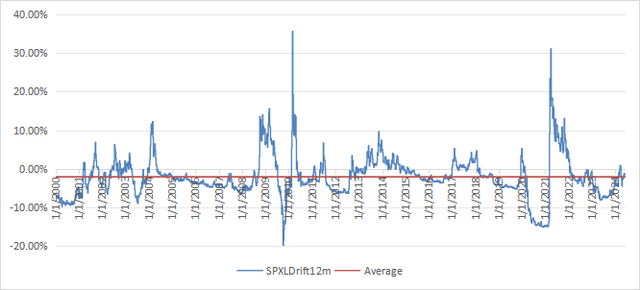
12-month drift of since January 2000 (synthetic prices) (Chart: author, data: Portfolio123)
SPXL and other 3x leveraged ETFs are not long-term investments. They are trading and hedging instruments meant to be used during limited periods of time by seasoned traders who have a good understanding of their behavior. For hedging purposes, 2x bear S&P 500 ETFs like ProShares UltraShort S&P500 ETF (SDS) are relatively safer, although they may suffer significant decay in highly volatile periods (analysis of SDS history).
Credit: Source link