
PM Images
There is no denying that fortunes can be made with dividends. Yet there is still some disagreement among investors on how exactly to implement dividend strategies in order not to fall into a typical trap when cash returned to shareholders cannot compensate for sluggish share price growth (or even its consistent decline), and in fact, most initially promising portfolios prove a flop for this exact reason, and instead of building fortunes over time, they result in them slowly disappearing, especially when adjusted for inflation.
I covered a plethora of dividend exchange-traded funds in the past and only few truly appealed to me. Today, I would like to discuss the Siren DIVCON Leaders Dividend ETF (BATS:LEAD), a vehicle with a perfect idea at its crux and numerous advantages to mull over. LEAD has impressed me with its steady performance, brilliant quality, and dividend growth credentials, but disappointed with its value exposure (also manifested in only a modest yield). Am I bullish on this fund then? Let us review it from a few angles to figure this out.
According to its website, incepted in January 2016, LEAD tracks the Siren DIVCON Leaders Dividend Index. The prospectus says the index is rebalanced and reconstituted annually. The principal idea here is that long-term growth of capital could be achieved by betting on U.S. large-cap names “with the highest probability of increasing their dividend in the next 12 months” selected using sophisticated quantitative screens. The fact sheet contains the following description:
The Index utilizes Reality Shares Inc.’s proprietary DIVCON methodology, a forward-looking dividend rating system designed to identify companies among the 500 largest U.S. companies by market capitalization with the highest probability to increase their dividends in a 12-month period based on seven quantitative factors.
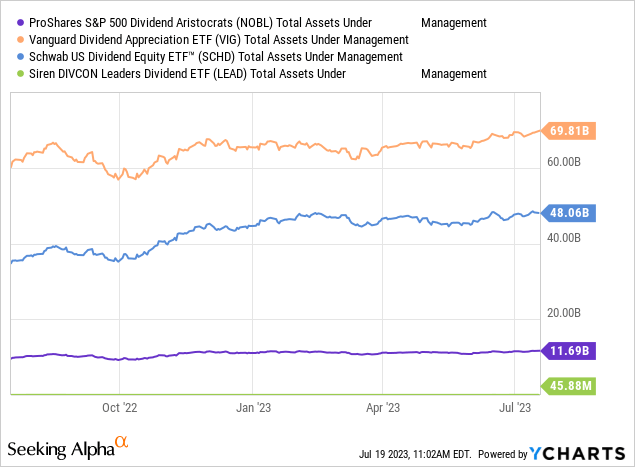
LEAD has amassed about $46 million in AUM. Its expense ratio of 43 bps looks adequate assuming its complex quantitative factor-based strategy.
LEAD confidently beat IVV and a few peers over certain periods
What makes a positive impression immediately is that with a 84.7% total return, LEAD trounced the iShares Core S&P 500 ETF (IVV) in the past five years, something that only First Trust NASDAQ Technology Dividend Index Fund (TDIV) and WisdomTree U.S. Quality Dividend Growth Fund (DGRW) in the pool of dividend ETFs I cover managed to achieve.
| Symbol | 5Y Perf | 5Y Total Return |
| LEAD | 72.36% | 84.74% |
| TDIV | 62.15% | 81.86% |
| DGRW | 59.92% | 78.43% |
| IVV | 61.52% | 76.43% |
Created using data from Seeking Alpha
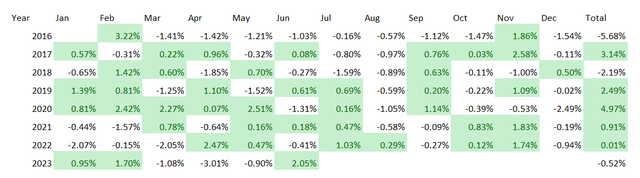
IVV/LEAD total returns comparison (Created by the author using data from Portfolio Visualizer)
This is a solid indication of LEAD weathering the pandemic with ease, and truly, the fund managed to navigate that period beating IVV by almost 5% in 2020 and by close to 1% in 2021, managing to benefit from the coronavirus growth names rally and then quickly adapting to the new market narrative deemed the capital rotation in 2021. A meaningful share of dividend-centered vehicles I cover were less successful during the pandemic because of their inherent value tilts and also owing to FX fluctuations that dented their returns.
Now, annualized returns, with the period being February 2016 – June 2023. For comparison purposes, I have added the two most popular (manifested in the size of their assets under management) dividend growth-centered vehicles Vanguard Dividend Appreciation Index Fund ETF Shares (VIG) and ProShares S&P 500 Dividend Aristocrats ETF (NOBL). The Schwab U.S. Dividend Equity ETF (SCHD), which also has a DPS growth ingredient, was added to ensure a wider context.
Here, LEAD demonstrated performance peers I selected could hardly compete with, even despite the expense ratio of 43 bps which detracted from its total return. However, the downsides are also clearly visible. First, it seems LEAD has a drawdown problem, which means it tends to decline deeper than the selected funds during bear markets. Another issue is the highest standard deviation in the group. At the same time, risk-adjusted returns represented by the Sharpe and Sortino ratios look healthy, even though less volatile VIG did marginally better.
| Portfolio | IVV | LEAD | NOBL | VIG | SCHD |
| Initial Balance | $10,000 | $10,000 | $10,000 | $10,000 | $10,000 |
| Final Balance | $26,280 | $26,693 | $22,642 | $24,735 | $24,494 |
| CAGR | 13.91% | 14.15% | 11.65% | 12.99% | 12.84% |
| Stdev | 15.96% | 16.25% | 15.47% | 14.33% | 15.49% |
| Best Year | 31.25% | 33.74% | 26.94% | 29.62% | 29.87% |
| Worst Year | -18.16% | -18.15% | -6.51% | -9.81% | -5.56% |
| Max. Drawdown | -23.93% | -24.49% | -23.23% | -20.19% | -21.54% |
| Sharpe Ratio | 0.82 | 0.82 | 0.71 | 0.83 | 0.77 |
| Sortino Ratio | 1.25 | 1.32 | 1.09 | 1.33 | 1.24 |
| Market Correlation | 1 | 0.96 | 0.92 | 0.95 | 0.91 |
Created by the author using data from Portfolio Visualizer
LEAD’s 5-year dividend CAGR is one of the strongest among vehicles I cover
LEAD’s DPS growth-centered strategy resulted in a fairly robust distribution growth story.
More specifically, in the 62-strong cohort of dividend ETFs I cover, only First Trust Rising Dividend Achievers ETF (RDVY), iShares Core Dividend ETF (DIVB), AAM S&P 500 High Dividend Value ETF (SPDV), and Xtrackers MSCI EAFE High Dividend Yield Equity ETF (HDEF) have stronger 5-year CAGRs. Importantly, the median in the group is only 5.8%.
| Symbol | Div Growth 5Y |
| RDVY | 22.66% |
| DIVB | 21.81% |
| SPDV | 18.33% |
| HDEF | 14.65% |
| LEAD | 14.25% |
Created using data from Seeking Alpha
The 3-year growth is a bit softer at 13.6%, which is weaker than the results of fifteen vehicles I cover, though again much higher than the median of 6.44%.
Quality is close to perfect
Another point to pay attention to is that LEAD is one of the highest-quality dividend mixes an investor can get. As of July 19, all the 52 holdings had an A (+/-) Quant Profitability grade; in fact, I have never encountered such strongly positioned portfolios. Uncoincidentally, all the companies featured are profitable and cash flow-positive. The weighted-average net margin is at 19%, as per my calculations.
It is also necessary to note the EY/DY spread of 3.9% (as the weighted average dividend yield is at only ~1.5%) indicates solid dividend durability. Interestingly, about 72% of net assets are allocated to stocks with double-digit 3-year dividend CAGRs; stocks with negative 3-, 5-year CAGRs are absent.
Bears have something to say: valuation is LEAD’s Achilles heel
The weighted-average market capitalization of LEAD stood at about $209 billion as of July 19, so small wonder this top-quality mix is rather expensive. Its earnings yield of ~5.4% looks much stronger than ~4% of the iShares Core S&P 500 ETF, yet the issue here is that the median is almost on par with IVV (~4.4%). And the WA figure is chiefly influenced by Marathon Petroleum (MPC), a capital-intensive refining business.
Also, there is a much more complex story beneath the surface. More specifically, about 79.7% of LEAD’s holdings are priced at a premium to their respective sectors and historical averages, which is illustrated by a D+ Quant Valuation grade or worse, while only 5% are comfortably priced (no less than a B- grade). So investors should understand that LEAD’s brilliant profitability profile comes with substantial valuation risks.
Final thoughts
LEAD features a dividend growth-centered equity mix designed to deliver capital appreciation over time. In the current iteration, it favors information technology (35.2%), industrials (22.8%), and healthcare (11.3%), while having only little interest in consumer staples (2.5%) and real estate (2.4%); utilities and communication services are completely ignored.
In the past, the strategy delivered rather strong total returns, beating a few dividend-centered peers and the market. The current version of the portfolio has phenomenally strong profitability factor exposure and numerous notable dividend growth stories under the hood. However, there are still a few nuances. First, its exemplary quality unsurprisingly results in a generous valuation. As a consequence, the dividend yield is tiny at only 1.1%. Second, with AUM of just $46 million, the fund has liquidity risks. In this regard, I assign it the Hold rating.
Credit: Source link