

Adam Gault
Quick Intro If You Are New To KMB’s Business
Kimberly-Clark (NYSE:KMB) is one of the key players in the personal care consumer products sector. KMB operates globally with sales realized in over 175 countries/regions and manufacturing in 33 countries (as of year-end 2023).
The Company’s brands are organized across three business segments:
- Personal Care includes, inter alia, diapers, wipes, feminine care products, swim pants, pants, reusable underwear
- Consumer Tissue includes, inter alia, napkins, paper towels, and tissues
- K-C Professional includes, inter alia, sanitizers, soap, towels, tissue, protective gear
The Personal Care segment holds the largest share in KMB’s sales structure, typically exceeding 50%, followed by ~30% Consumer Tissue segment, and a low double-digit K-C Professional segment. Please review the chart below for details.
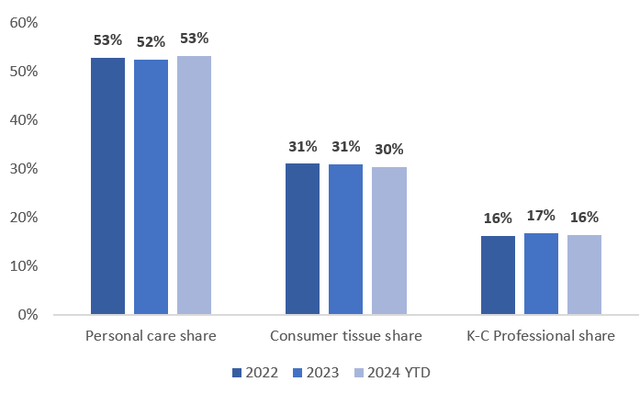
Author based on KMB
As the Company operates globally, it distinguishes three geographical segments – North America, D&E Markets, and Developed Markets:
We describe our business outside North America in two groups – Developing and Emerging Markets (“D&E”) and Developed Markets. D&E Markets comprise Eastern Europe, the Middle East and Africa, Latin America and Asia-Pacific, excluding Australia and South Korea. Developed Markets consist of Western and Central Europe, Australia and South Korea.
Over half of KMB’s revenue is derived from North America.
Without Further Ado – Investment Thesis
KMB has good things going for it and showcases:
- resilient business model
- sustainable profitability
- solid organic growth
- globally diversified operations
However, some of the other popular fast-moving consumer goods sector representatives have a few competitive edges over KMB, including:
- higher profitability
- less extensive impact of FX fluctuations
- better product category diversification
- more cash-generation potential
- less headwinds regarding revenue growth
While I don’t consider KMB overvalued, I don’t see much upside potential resulting from multiple expansion, as the discount to some of its peers is justified.
Nevertheless, KMB is a stable business with every day products that isn’t going anywhere, so it’s a 100% worth holding business for already invested people, especially those who secured relatively attractive entry-levels, and thus, high yield-on-cost.
Therefore, KMB is a ‘hold’ for me.
Kimberly-Clark Is Not Overvalued, Here’s Why
I’m surprised by the number of investors relying on the share price as a proxy for determining the over/undervaluation of a given business. I am an M&A advisor – I am involved in transactional processes on a day-to-day basis and let me tell you – when I bid or receive non-binding offers I don’t see fixed-price offers.
What do I see instead? Multiples. Multiples are constructed of a ‘value’ component and a ‘financial metric’ component, which means that a bidder is willing to pay ‘X’ amount of times that ‘financial’ metric for the business. Taking the rule of thumb (for most sectors) multiple – EV/EBITDA, investors bid, for example, 10.0x (10 times) EBITDA, which leads us to the Enterprise Value of the business – subject to some adjustments related to net debt or working capital (e.g.).
Relying solely on the stock price leaves many things open, for example:
- stock repurchases/issues, which also impact the stock price and may not have much in common with the value of a business
- the changing scale and profitability of the business
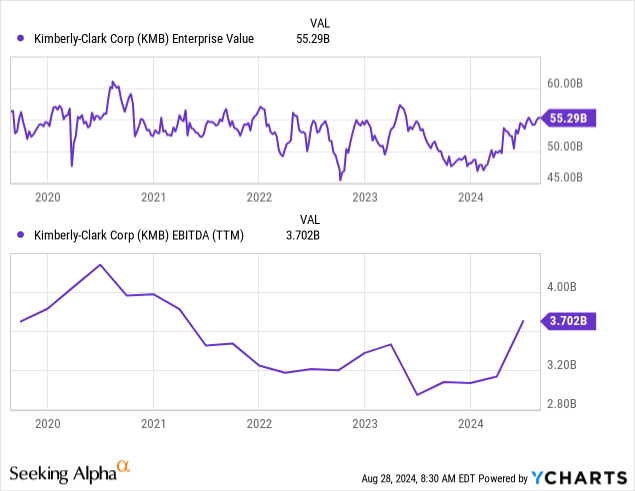
With that said, let’s take a look at KMB’s Enterprise Value and EBITDA for the last 5 years, depicted in the charts below.
If we combine the above metrics, we will create the most commonly used multiple transaction processes – EV/EBITDA, depicted in the chart below.
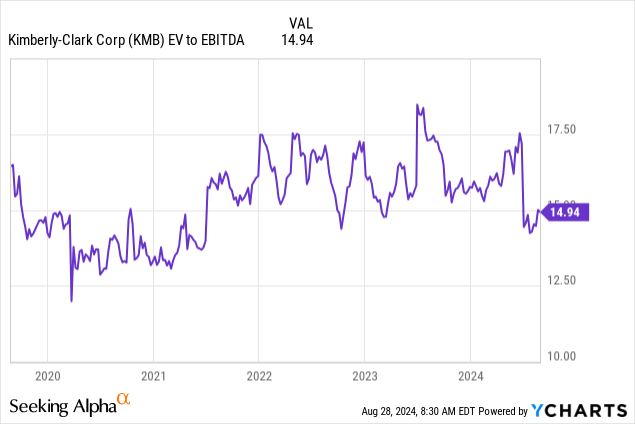
As we can see, KMB witnessed decreasing EBITDA since 2020 (until ~2024), but its Enterprise Value hasn’t responded with the same degree of decline, leading its EV/EBITDA as high as over 17.5x in mid-2023. After that, the Enterprise Value dropped noticeably, leading to a dip recorded at the beginning of 2024. KMG’s EV has been recovering since, but it’s worth recognizing that its EBITDA has also increased substantially – driving its EV/EBITDA downwards.
The right question in this scenario is – how does KMB business stand, and is the recent increase in EBITDA sustainable? We will come back to it later, but first, let’s look at the valuation multiples of some of KMB’s peers. The forward-looking EV/EBITDA multiple stood at:
- 13.8x for Kimberly-Clark
- 17.5x for Procter & Gamble (PG)
- 18.7x for Colgate-Palmolive (CL)
- 19.0x for Church & Dwight (CHD)
As we can see, KMB trades at a significant discount to some of its peers. Let’s try to examine whether that discount is justified in light of a reasonable historical EV/EBITDA multiple of the Company.
Deep Dive Into KMB’s Business
The scale of revenue and its growth decomposition
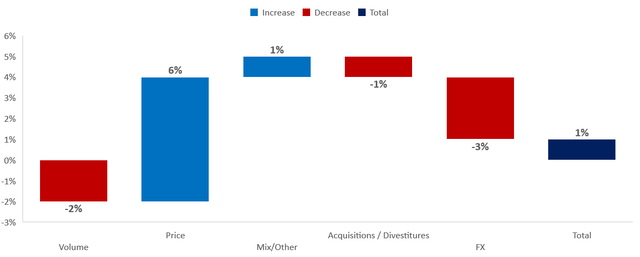
KMB is noticeably smaller than PG, but its revenue scale is similar to CL. During the last couple of years, the Company recorded low single-digit revenue growth. For instance, KMB grew its revenue by 1.3% year-over-year in 2023. The growth was achieved mainly through:
- positive pricing effect (6%)
- positive mix effect (1%)
- offset by volume decline (-2%)
- offset by FX fluctuations (-3%)
- divestitures impact (-1%)
Please review the chart below for details regarding KMB’s sales growth decomposition in 2023.
Author based on KMB
The Company recorded some issues within the D&E segment, as its revenue declined by 6%, while NA and DM showcased 5% and 3% sales growth, respectively.
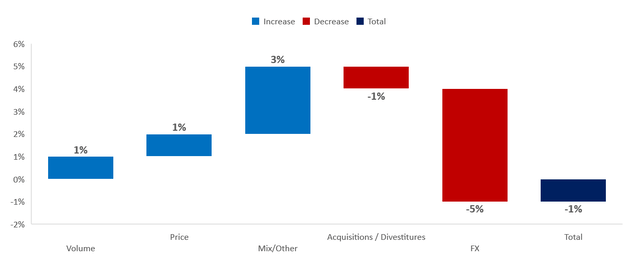
Looking at the 2024 YTD performance, the Company recorded similar organic growth (~5% incl. 1% volume growth, 1% pricing effect, and 3% mix effect), but it faced stronger FX hardships, which weighed on the growth by 5%. In total, KMB’s consolidated revenue decreased by 1% in Q1-Q2 2024 vs Q1-Q2 2023. Please review the chart below for details:
Author based on KMB
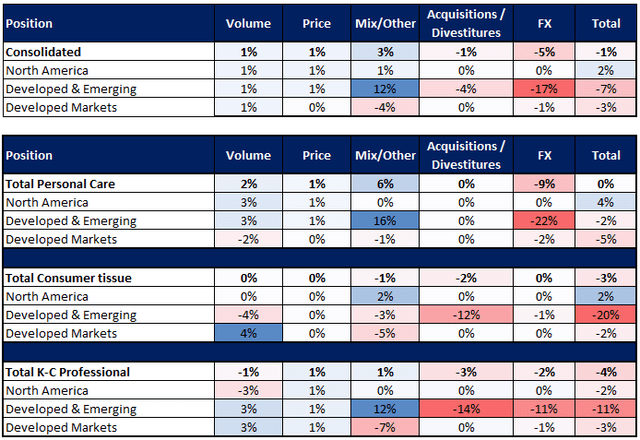
The North America segment performed positively in the Personal Care and Consumer Tissue divisions (unlike D&E and DM segments), but the K-C Professional recorded sales decreases in each geographical segment. It’s worth recognizing that the D&E segment was negatively influenced primarily through the FX fluctuations. It was a solid 6 month period in terms of volume-mix growth, but the headwinds were noticeable. To quote the management’s comment on that and the expectations for the upcoming quarters:
Importantly, in some of our largest, most profitable geographies like the U.S., China, and the U.K., we saw solid volume mix growth, which is something we’ve been folks focusing on. And as Mike said, I mean, it is the key for our long-term algorithm.
(…)
As we think of cadence of first half second half on the top line, we would expect the second half to grow at a similar pace of what we saw in the second quarter with again volume and mix key drivers of growth, while pricing will continue to play a lesser role sequentially.
Please review the tables below for details regarding KMB’s sales growth decomposition in Q1-Q2 2024 vs Q1-Q2 2023.
Author based on KMB
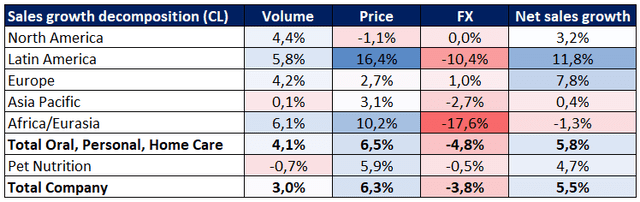
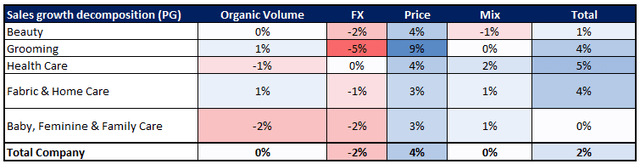
For some benchmarks, please review the tables below presenting CL’s (Q1-Q2 2024 vs Q1-Q2 2023) and PG’s (FY 2024 vs FY 2023) growth, respectively. Both entities tend to realize higher sales growth than KMB, driven by different factors.
Author based on CL
Author based on PG
Are paper products a profitable segment of the consumer products sector?
Do you remember when many retailers were running out of toilet paper stock during the COVID-19 pandemic? They were not and still are not incentivized to hold onto large stocks of toilet paper, as it takes a lot of place and generates inventory costs. But there’s another reason – paper products are generally low-margin products, due to relatively high production and raw materials costs and their commoditized nature.
That is well-reflected within KMB’s profitability when compared to some other consumer sector players that concentrate on different product categories.
Please review the chart below for details regarding CL’s and KMB’s gross profit and adj. EBITDA margins.
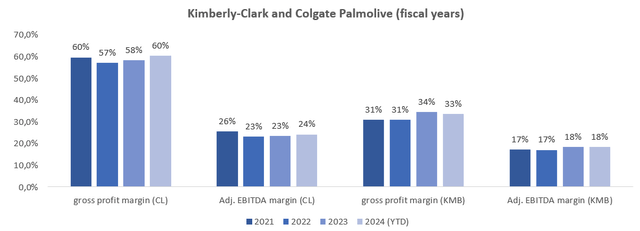
Author based on KMB and CL
Please note that I included Net sales, Cost of goods sold, SG&A expenses, and other expenses in the Operating Income calculation, then adjusted for depreciation and amortization costs to get EBITDA. I also adjusted the EBITDA margin for impairment charges for intangible assets.
For further benchmarking, please review the chart regarding PG.
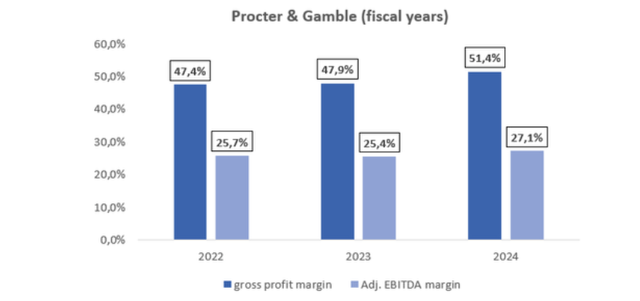
Author based on PG
As we can observe, KMG records by far the lowest gross profit margins ranging from 30% to 34%, compared to:
- CL’s ranging from 57% to 60%
- PG’s ranging from 47% to 52%
The difference in adj. EBITDA margin is noticeably lower, but the relationship remains with KMB recording the lowest profitability in terms of this metric, around 5 to 8 percentage points lower than CL and PG.
Nevertheless, the profitability is there – so are shareholder rewards
KMB’s profitability ensures positive operational cash flow, supporting shareholder rewards that amounted to (during the 2018–2024 YTD period):
- $9.7b of dividend payments
- $3.1b of share repurchases
Although KMB’s dividend yield remains attractive when compared to PG or CL, one has to be aware that PG’s and CL’s profitability allows them to generate more cash. For instance, the share of PG’s operating cash flow in its revenue generally exceeds 20%, while KMB’s ranged from 13% to 17% in 2022–2024 YTD.
Please review the chart below for details regarding KMB’s shareholder rewards.
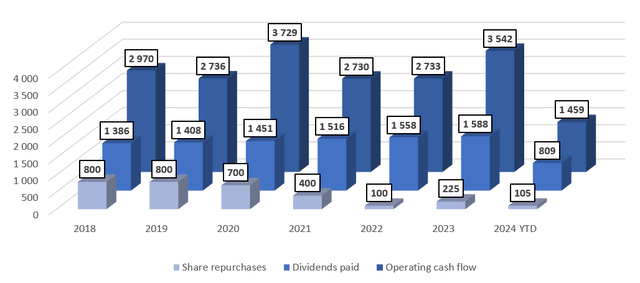
Author based on KMB
Key Takeaways
Each stock market investment comes with risk factors to consider:
- uncertainty regarding the interest rate environment
- foreign exchange fluctuations that have already shown extensive impact on KMB’s business
- lower profitability compared to other FMCG players
- lower revenue growth compared to other FMCG players
- limited positive impact of solid organic growth due to other factors overweight
- growth issues D&E markets (due to FX fluctuations) and DM markets (negative organic growth incl. mix effect)
While I don’t consider KMB overvalued, I don’t see much upside potential resulting from multiple expansion. I consider PG’s or CL’s valuation premiums to KMB justified due to faster growth, less extensive FX impact, and higher profitability.
Nevertheless, KMB is a stable business with every day products that isn’t going anywhere, so it’s a 100% worth holding business for already invested people, especially those who secured relatively attractive entry-levels, and thus, high yield-on-cost.
Therefore, KMB is a ‘hold’ for me. Thank you!
Credit: Source link