
Douglas Rissing
Bank stocks remain down since I last urged for caution (here and here), but the sector-wide rally over the last week has provided some much-needed relief for investors after a tumultuous year. In the aftermath of Silicon Valley Bank’s (SVB) failure, key management teams (see JPMorgan (JPM) chief Jamie Dimon’s commentary and first-ever stock sale) and investors (see “Big Short” investor Steve Eisman’s commentary) have gone on record to declare the entire sector “uninvestable.”
After last week’s Q4 refunding/FOMC double-header, you’d be hard-pressed to disagree. Amid higher for longer rates and with the Treasury’s focus on front-end issuances likely to keep the curve inverted for some time, rising deposit betas (i.e., the sensitivity of interest-bearing deposits to short-term interest rates) will continue to be an issue for net interest income. The SPDR S&P Bank ETF (NYSEARCA:KBE) skews toward mid-caps and regionals, many of which lack insulation from fee-related income streams. These banks should struggle the most in a higher deposit cost/sluggish loan growth backdrop.
Asset quality stress is an added cyclical tail risk should the lagged impact of higher rates start to bite. On the regulatory side, the secular trend toward increased oversight and higher capital requirements will further crimp banks’ structural earnings power, leaving limited capacity for future shareholder returns as well. Having rebounded over the last week, KBE doesn’t screen all that cheaply now that the portfolio is priced at book value parity. Net, I would remain neutral here.
Fund Overview – A Well-Diversified, Competitively Priced Play on US Banks
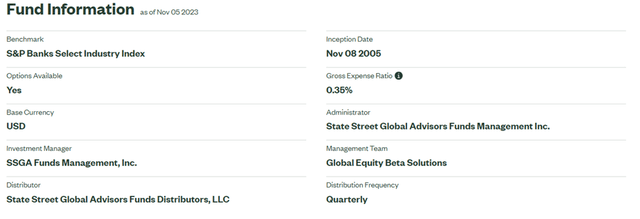
State Street’s SPDR S&P Bank ETF tracks (pre-expenses) the performance of the equal-weighted S&P Banks Select Industry Index, a basket of bank stocks mainly spanning the US regional and diversified banking universe. The ETF manages $1.1bn of assets and charges a 0.35% expense ratio, in line with comparable banking sector ETFs like the Invesco KBW Bank ETF (KBWB).
State Street
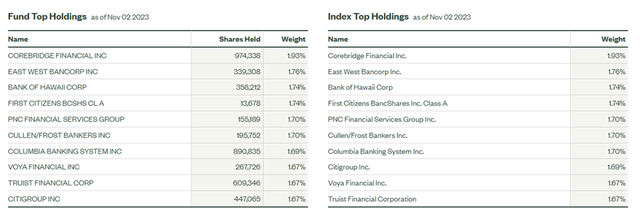
Unlike the large cap-heavy KBWB portfolio, KBE’s banking exposure is skewed toward smaller regional banks (65.4%), a result of the fund’s equal weight policy. By comparison, larger cap diversified banks contribute a much smaller 16.3%. As all of KBE’s 90 bank holdings are kept below the 2% threshold, its portfolio is fairly well spread out. In line with its benchmark S&P Banks Select Industry Index, Corebridge Financial (CRBG) and East West Bancorp (EWBC) are currently the two largest KBE holdings at 1.9% and 1.8%, respectively.
State Street
Fund Performance – Headed for One of its Worst Years on Record
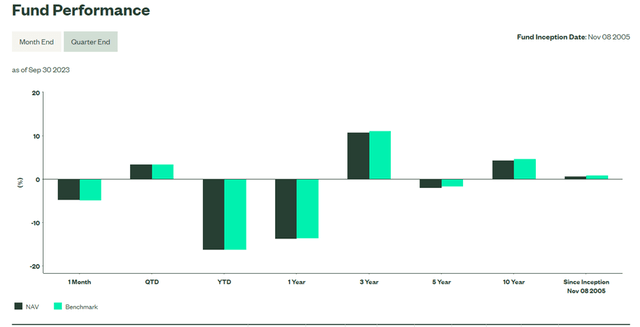
Coming off a mixed Q3 earnings season for the banks, KBE has seen its returns further decay by ~4.8% over the last month, driving total NAV returns this year to -16.3% (-16.2% in market price terms). While KBE has outperformed key ETF comparable KBWB (down 20.0% YTD), both bank ETFs have far underperformed the broader financial universe, with the S&P 500 Financials Index, tracked by State Street’s Financial Select Sector SPDR Fund (XLF) only down by -1.7% for the year.
Even over longer timelines, KBE has delivered disappointing shareholder returns – since inception in November 2005, the fund has compounded at an annualized +0.7% (NAV and market price terms). Across five and ten-year timelines, the fund has returned -1.9% and +4.3%, respectively, in line with KBWB but trailing XLF and the broader S&P 500 (SPY) by a considerable margin. Perhaps the only area the fund has consistently excelled at is its narrow tracking error (after expenses) vs. the fund’s benchmark S&P Banks Select Industry Index – despite the periodic rebalancing needed to maintain an equal-weighted portfolio composition.
State Street
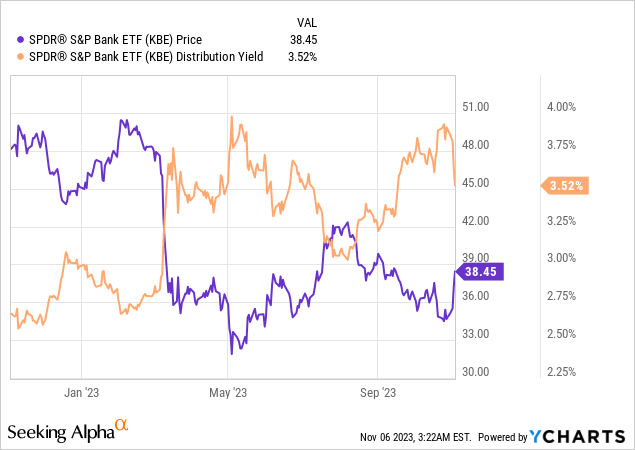
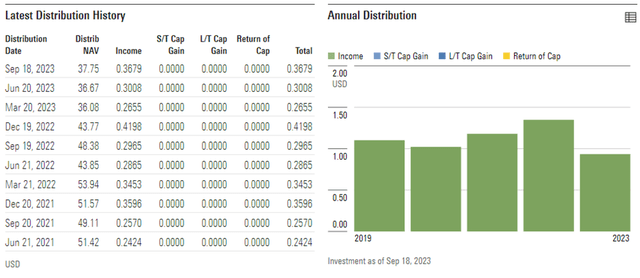
Like KBWB and other bank funds, KBE maintains one of the highest distribution yields within the S&P sector ETF universe at 3.5-3.6%. The June and September distributions have also come in ahead of last year’s, more than making up for the subpar Q1 payout, so the KBE yield could well see upside from here. Still, its more broadly diversified portfolio means its yield trails KBWB by ~40bps; thus, investors who don’t mind taking on concentration risk for some extra income should probably opt for the latter.
Morningstar
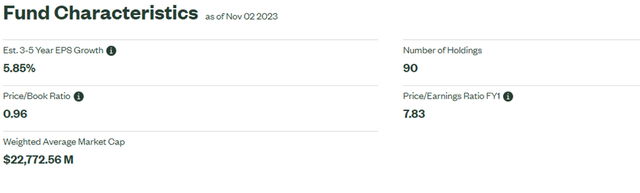
Whether both funds can sustain this pace of capital return (including buybacks) longer-term is the question, though, given the mounting regulatory headwinds US banks will need to navigate. The market is seemingly expressing a pessimistic view of the sector, with the KBE portfolio now on offer at 1x P/Book and ~8x P/E. Relative to consensus estimates for steep regional bank earnings declines again next year (-9% in 2023; -8% in 2024). KBE still has room to de-rate, in my view, should we see more disappointments.
State Street
Deposit Headwinds Haven’t Abated
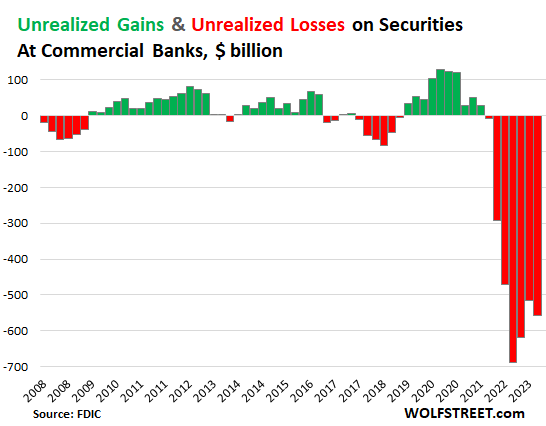
Concerns about bank solvency may have eased in recent months, but the slew of bank failures earlier this year has created a more rate-sensitive depositor base. Alongside rising front-end Treasury yields, banks have seen upward pressure on their cost of funds, as evidenced by the rising percentage mix of interest-bearing deposits in the system. Yet, banks remain constrained on deposit rate pass-through due to their investments in lower-yielding reserve balances and underwater securities portfolios through the QE days.
Wolf Street
As a result, national average deposit rates are still well below the +5% yield offered by money market funds. It’s no surprise, then, that much of the deposit outflows from the regionals and small to mid-caps earlier this year haven’t reversed. In fact, things may have gotten even worse, with total US banking system deposits experiencing more outflows last month, led by large domestic banks.
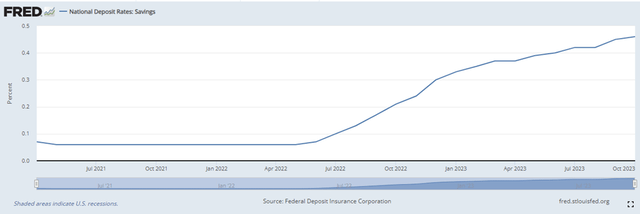
Federal Reserve
To an extent, recent deposit headwinds are cyclical rather than structural and should ease as inverted yield curves un-invert (history says this is inevitable over a long enough timeline). Yet, banks operate in an increasingly digitized environment, which means not only more competition for excess savings (e.g., fintechs and asset managers) but also more “flighty” deposits able to move a lot quicker than in the past. To plug the shortfalls, banks may have to bring less stable funding sources (e.g., pricier brokered deposits) onto their balance sheets, adding to the upward pressure on their cost of funds. Key KBE sub-sectors like regionals and small to mid-cap domestic banks are set to be hit the hardest by these changes, while larger, more diversified universal banks are better equipped to attract uninsured deposit flows long-term.
Lending Headwinds on the Horizon
The other side of the balance sheet isn’t doing that great, either. Recent lending data indicates underwriting standards are tightening – per the Fed’s Quarterly Loan Officer Survey, commercial and industrial, commercial real estate, and consumer loans have suffered the most. Also concerning is the lagged impact of higher rates on growth and labor market conditions, both of which should weigh on loan demand in the coming months. Plus, owning a bank portfolio into a potential rate cut cycle next year (per the Fed’s dot plot), a big negative for net interest margins, isn’t appealing.
As KBE’s bank portfolio isn’t as diversified by business line (mainly traditional banking) or geography (mainly domestic/regional), the fund is highly levered to a slowdown. Given the double whammy of higher funding costs and slowing loan growth, expect more net interest income declines next year (note consensus pegs regional earnings growth at -8% for 2024). Beyond the near-term cyclical factors, there’s also a clear structural trend to worry about, with banks coming under more regulatory oversight and needing to hold more capital post-SVB. The latter, in particular, will have a tangible impact on balance sheet growth and ROEs. By extension, capital returns (dividends and buybacks), traditionally a key part of the US bank thesis, look poised for more downside than upside in the coming years.
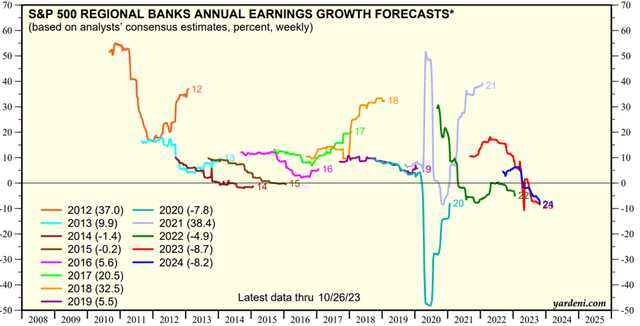
Yardeni
Banks Are Cheap For A Reason
The backdrop for banks remains as unfavorable as ever. While last week’s relief rally has emboldened the bulls, an inverted yield curve and a peaking rate cycle means bank net interest margins will remain under pressure from all sides. Concerns about bank balance sheets and asset quality should the economy move into recession next year also weigh on the near-term earnings power. In the long run, the post-SVB shift toward more regulations and capital requirements poses downside to the earnings power of banks’ borrowing/lending operations.
Unlike universal banks with sizeable brokerage and wealth management businesses, mid-caps, and regionals, the key components of KBE’s portfolio have little insulation from these headwinds and could underperform as a result. At ~1x book and ~8x earnings (vs. consensus expectations for low to mid-single-digit % earnings declines in 2023/2024), the KBE portfolio isn’t yet cheap enough to warrant a position.
Credit: Source link