
• bitcoinBitcoin(BTC)$85,950.006.55%
  • ethereumEthereum(ETH)$2,742.676.11%
  • tetherTether(USDT)$1.000.01%
  • binancecoinBNB(BNB)$797.845.92%
  • rippleXRP(XRP)$1.508.92%
  • usd-coinUSDC(USDC)$1.000.01%
  • solanaSolana(SOL)$118.229.25%
  • tronTRON(TRX)$0.3449640.10%
  • zcashZcash(ZEC)$1,524.376.03%
  • Figure HelocFigure Heloc(FIGR_HELOC)$1.020.00%
  • HyperliquidHyperliquid(HYPE)$94.173.49%
  • dogecoinDogecoin(DOGE)$0.09468911.21%
  • moneroMonero(XMR)$576.226.66%
  • whitebitWhiteBIT Coin(WBT)$86.465.52%
  • RainRain(RAIN)$0.01411711.00%
  • chainlinkChainlink(LINK)$13.027.26%
  • USDSUSDS(USDS)$1.000.02%
  • cardanoCardano(ADA)$0.24441010.26%
  • leo-tokenLEO Token(LEO)$8.990.62%
  • stellarStellar(XLM)$0.21147810.33%
  • uniswapUniswap(UNI)$8.913.34%
  • nearNEAR Protocol(NEAR)$4.1312.47%
  • bitcoin-cashBitcoin Cash(BCH)$264.397.60%
  • avalanche-2Avalanche(AVAX)$11.192.85%
  • Ethena USDeEthena USDe(USDE)$1.000.02%
  • litecoinLitecoin(LTC)$62.7610.12%
  • daiDai(DAI)$1.000.01%
  • CantonCanton(CC)$0.1154639.03%
  • USD1USD1(USD1)$1.000.02%
  • suiSui(SUI)$1.0426.39%
  • the-open-networkGram (prev. Toncoin)(GRAM)$1.444.82%
  • hedera-hashgraphHedera(HBAR)$0.0914644.44%
  • shiba-inuShiba Inu(SHIB)$0.0000068.80%
  • MemeCoreMemeCore(M)$1.50-2.43%
  • Global DollarGlobal Dollar(USDG)$1.000.01%
  • BittensorBittensor(TAO)$285.3413.34%
  • crypto-com-chainCronos(CRO)$0.06424510.12%
  • paypal-usdPayPal USD(PYUSD)$1.000.02%
  • tether-goldTether Gold(XAUT)$4,341.46-0.63%
  • okbOKB(OKB)$123.096.04%
  • Circle USYCCircle USYC(USYC)$1.140.01%
  • BitwayBitway(BTW)$0.9024.94%
  • Ripple USDRipple USD(RLUSD)$1.000.00%
  • BlackRock USD Institutional Digital Liquidity FundBlackRock USD Institutional Digital Liquidity Fund(BUIDL)$1.000.00%
  • Ondo US Dollar YieldOndo US Dollar Yield(USDY)$1.150.00%
  • EthenaEthena(ENA)$0.22357011.96%
  • aaveAave(AAVE)$145.518.11%
  • OndoOndo(ONDO)$0.4484309.51%
  • mantleMantle(MNT)$0.647.28%
  • AsterAster(ASTER)$0.764.14%
TradePoint.io
  • Main
  • AI & Technology
  • Stock Charts
  • Market & News
  • Business
  • Finance Tips
  • Trade Tube
  • Blog
  • Shop
No Result
View All Result
TradePoint.io
No Result
View All Result

Junta Of Mega-Cap Stocks Rules

June 17, 2024
in Market & News
Reading Time: 5 mins read
A A
Junta Of Mega-Cap Stocks Rules
ShareShareShareShareShare

Aleksandra Zhilenkova

A market hooked on a handful of mega-cap stocks is a precarious place to be.

The Russell 2000, which tracks the smallest 2000 stocks in the Russel 3000, fell 1.6% on Friday, was in the red year-to-date, was back where it had first been in January 2021, and was down 18% from its all-time high in November 2021 (data via YCharts).
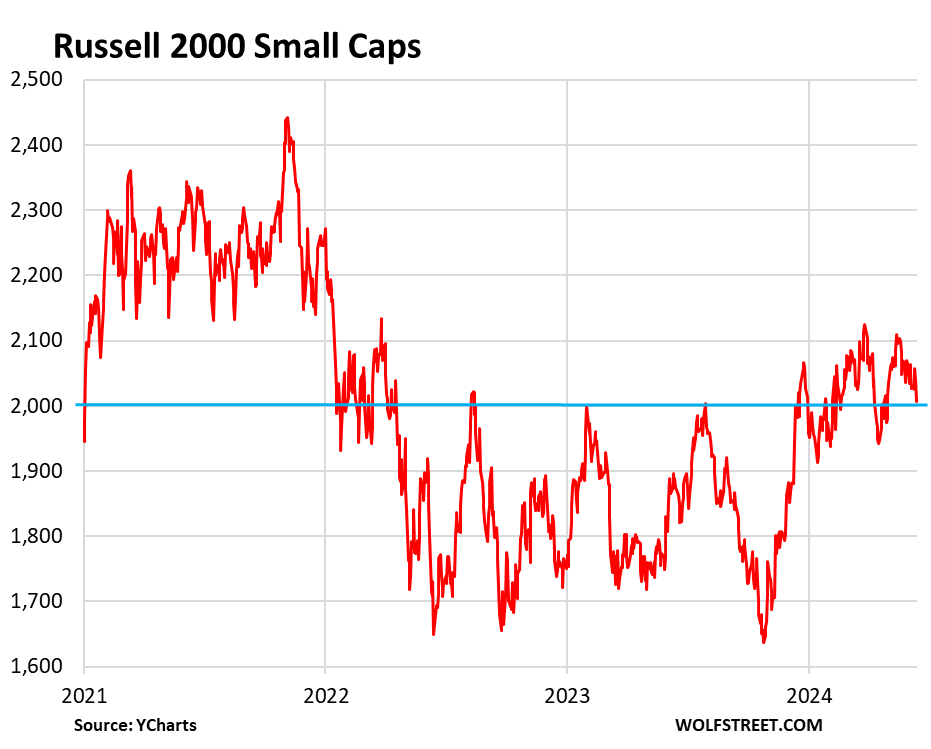
Chart showing Russell 2000 performance

But the Nasdaq Composite eked out the fifth record close in a row on Friday, and was up 9.1% from its previous-cycle high in November 2021 – having surged by 73% from the big-trough low in December 2022. Just another day in a hyper-precarious stock market where the entire world has whipped a handful of huge multi-trillion dollar stocks into frenzy (all data here via YCharts).
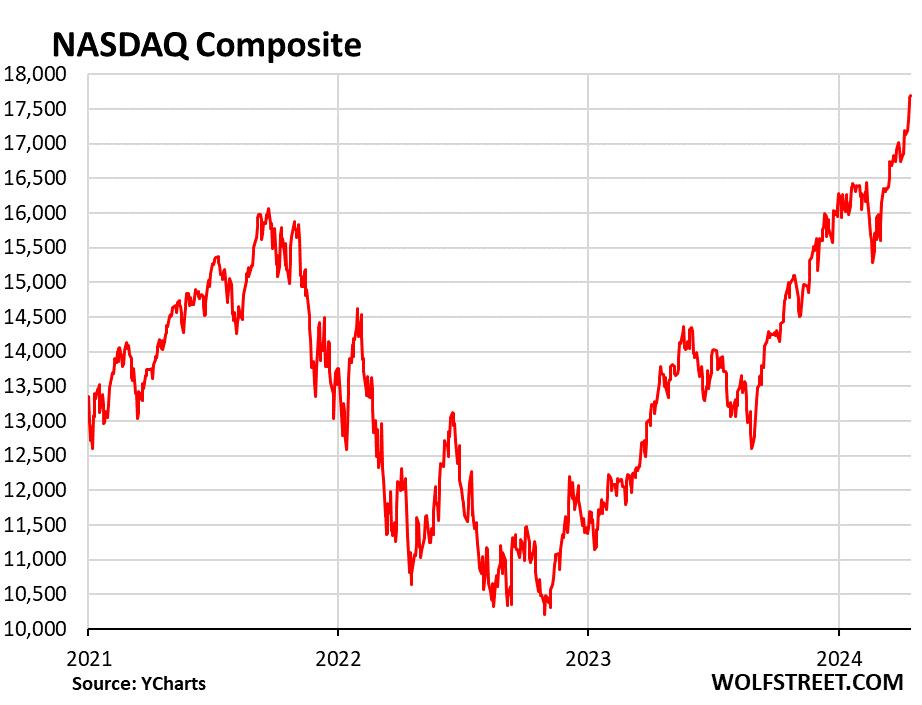
Chart showing performance of Nasdaq Composite index

The S&P 500 Index is now governed by a junta of three stocks with a combined market cap of nearly $10 trillion (Nvidia (NVDA), Apple (AAPL), and Microsoft (MSFT)) and another three stocks with a combined market cap of $5.4 trillion (Amazon (AMZN), Alphabet (GOOG, GOOGL), and Meta (META)). Those six stocks combined have a market cap of $15.2 trillion.

All of the 503 or so stocks in the S&P 500 combined have a market cap of about $45 trillion. Without those six stocks, the S&P 497 would have a market cap of $30 trillion. This entire market lives and dies by these six stocks. A fund that reflects the S&P 500 has a third of its holdings in just six stocks. Forget diversification?

So the S&P 500 was just a hair in the red on Friday, and a hair off its all-time high, up by 13.3% from its previous-cycle high on January 3, 2022, with a big trough in between.
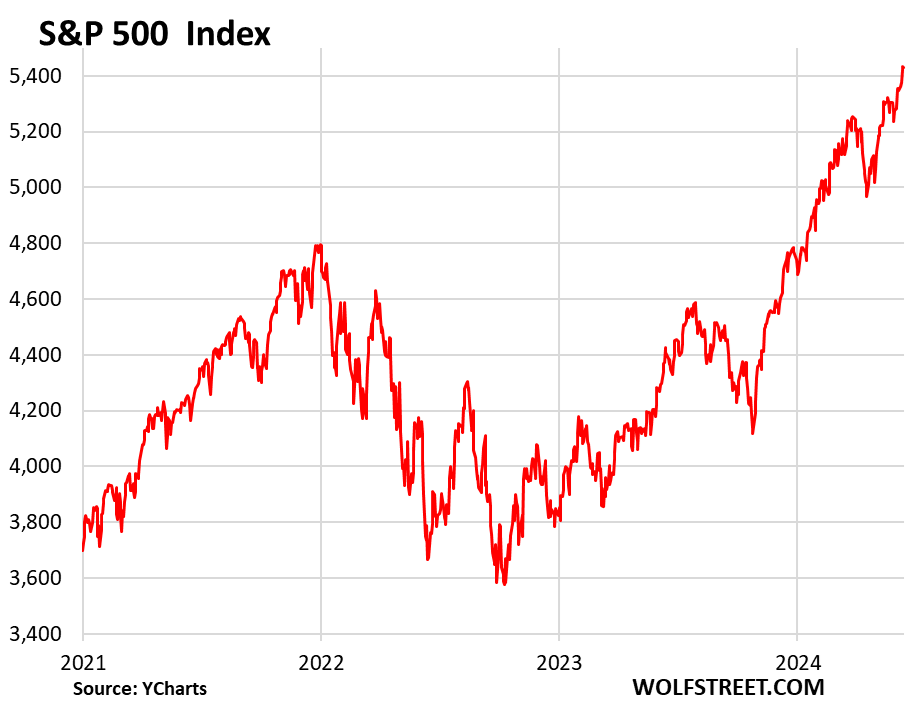
Chart showing percentage of S&P 500 index

The S&P 500 Equal Weight index is not weighted by market capitalization. It contains the same stocks as the S&P 500 index, but all stocks weigh the same within the index. The purpose is to see if the performance of a small number of outliers with huge market capitalizations is driving the overall S&P 500 index and is in effect hiding what is happening to the rest of the market. And that’s the case.

The index fell 0.7% on Friday, is down 3.8% from its all-time high on March 28, and is right back where it had first been on January 4, 2022.
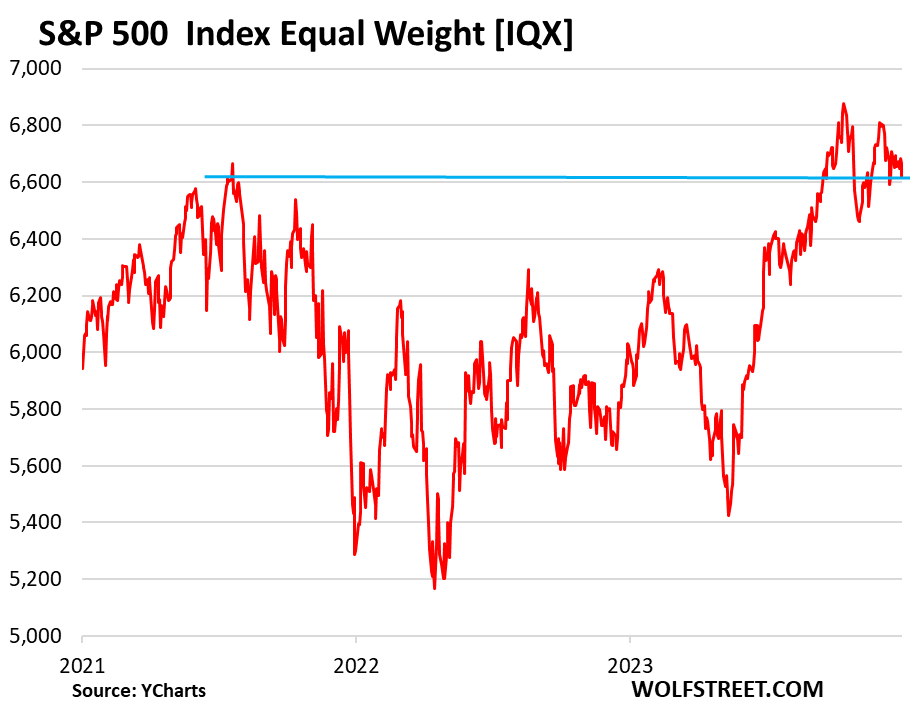
Chart showing performance of S&P 500 equal weight index

Year-to-date: For the year 2024 so far, the Russell 2000 (red) is down 1%; the S&P 500 Equal Weight (maroon) is up 3.4%, while the S&P 500 (purple) is up 13.9% and the Nasdaq Composite (light blue) is up 17.8%.

So that’s a very funny-looking split in the stock market:
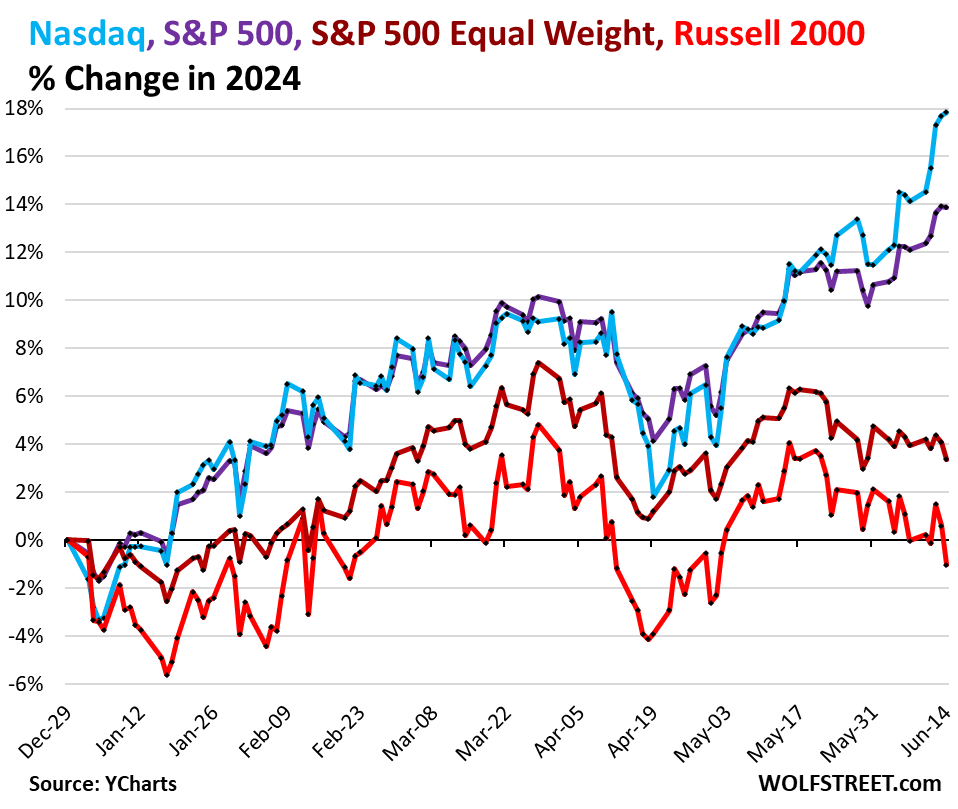
Chart showing percentage change in 2024 for Nasdaq, S&P 500, S&P equal weight index and Russell 2000 index

The Mag 7 is now a misnomer. Tesla (TSLA) fell out of the group. Its market cap plunged by 56% from its all-time high to $557 billion, less than half the market cap of Meta, which is the next smallest in line with a market cap of $1.28 trillion. But to revel in nostalgia, we’ll keep Tesla in the chart below (green).

What happened to Tesla – a 56% drop from the high, and a 75% drop at one point – can happen to any of the Mag 7.

YOU MAY ALSO LIKE

Small plane crashes on Florida beach

Rescued mountain climber speaks out after daring 15-hr mission

In 2023 and year-to-date in 2024, Tesla is up 44%, still a massive increase in normal times, but that’s the smallest increase of the Mag 7.

The Mag 7, in 2023 and year-to-date in 2024:

  • Nvidia: +802%
  • Meta: +319%
  • Amazon: +119%
  • Alphabet: +101%
  • Microsoft: +84.6%
  • Apple: +64%
  • Tesla: +44%.

Five of these Mag 7 are the biggest stocks in the universe in terms of market value. The entire world is now invested in them. They massively move the needle, and they move the needle even when the rest of the market is pulling against them. Having the big indices – and portfolios – hooked on just a handful of stocks is a very precarious place to be. But that’s what it is.
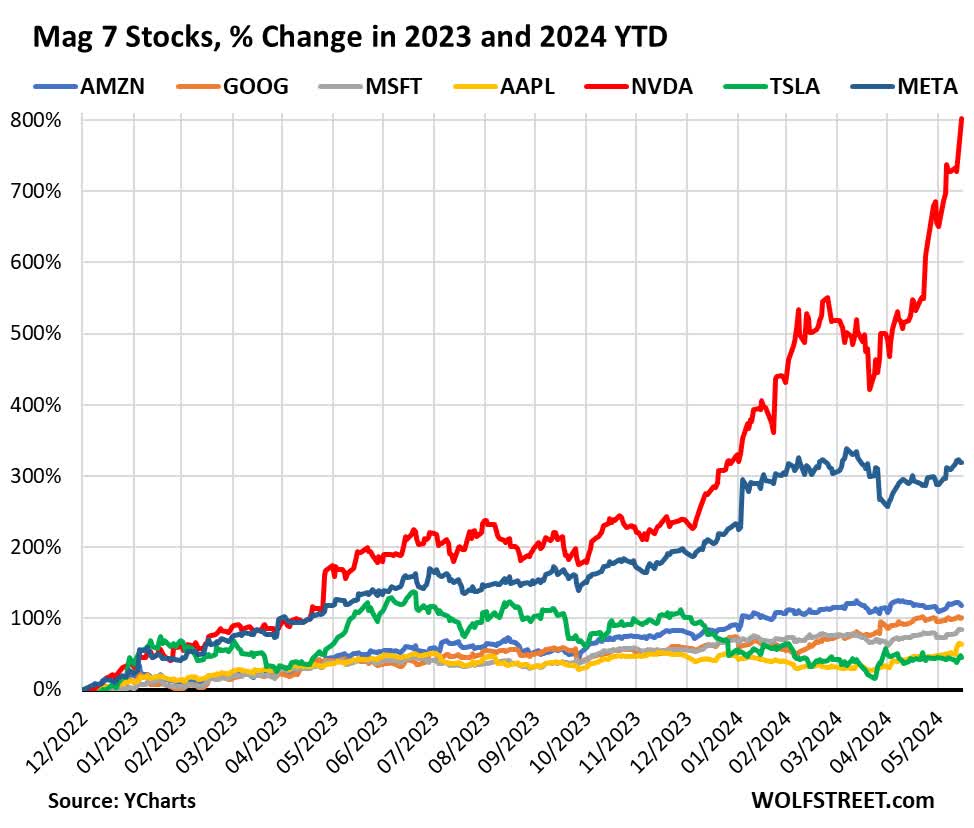
Chart showing percentage change in 2023 and 2024 year-to-date for Mag 7 stocks

Original Post

Editor’s Note: The summary bullets for this article were chosen by Seeking Alpha editors.

Credit: Source link

ShareTweetSendSharePin

Related Posts

Small plane crashes on Florida beach
Market & News

Small plane crashes on Florida beach

September 21, 2026
Rescued mountain climber speaks out after daring 15-hr mission
Market & News

Rescued mountain climber speaks out after daring 15-hr mission

September 21, 2026
Far-right commentator Milo Yiannopoulos arrested by ICE
Market & News

Far-right commentator Milo Yiannopoulos arrested by ICE

September 21, 2026
Parent seen tripping 9-year-old boy during football game
Market & News

Parent seen tripping 9-year-old boy during football game

September 21, 2026
Next Post
Appeals court to hear challenges to potential US TikTok ban on Sept. 16

Appeals court to hear challenges to potential US TikTok ban on Sept. 16

Leave a Reply Cancel reply

Your email address will not be published. Required fields are marked *

Search

No Result
View All Result
Chase Sapphire Reserve® Review – Worth 5 Only If You Use the Credits

Chase Sapphire Reserve® Review – Worth $795 Only If You Use the Credits

September 20, 2026
Reddington calls for removal of juror in Lindsay Clancy trial

Reddington calls for removal of juror in Lindsay Clancy trial

September 18, 2026
Ex-Apple Researchers’ Nuance Labs Lands M Series A Backed by Nvidia – Unite.AI

Ex-Apple Researchers’ Nuance Labs Lands $50M Series A Backed by Nvidia – Unite.AI

September 14, 2026

About

Learn more

Our Services

Legal

Privacy Policy

Terms of Use

Bloggers

Learn more

Article Links

Contact

Advertise

Ask us anything

©2020- TradePoint.io - All rights reserved!

Tradepoint.io, being just a publishing and technology platform, is not a registered broker-dealer or investment adviser. So we do not provide investment advice. Rather, brokerage services are provided to clients of Tradepoint.io by independent SEC-registered broker-dealers and members of FINRA/SIPC. Every form of investing carries some risk and past performance is not a guarantee of future results. “Tradepoint.io“, “Instant Investing” and “My Trading Tools” are registered trademarks of Apperbuild, LLC.

This website is operated by Apperbuild, LLC. We have no link to any brokerage firm and we do not provide investment advice. Every information and resource we provide is solely for the education of our readers. © 2020 Apperbuild, LLC. All rights reserved.

No Result
View All Result
  • Main
  • AI & Technology
  • Stock Charts
  • Market & News
  • Business
  • Finance Tips
  • Trade Tube
  • Blog
  • Shop

© 2023 - TradePoint.io - All Rights Reserved!