

Richard Drury
Overview
Nuveen Real Asset Income and Growth Fund (NYSE:JRI) initially caught my attention back in 2017 because of its high dividend yield and consistent price trading range. JRI remained on my watchlist for a handful of years now, and I’ve admittedly dropped the ball on keeping myself up to date on the outcome of this fund. The current environment of economic data that supports interest rate cuts shifted my attention back to JRI, as I believe that the fund may see a price increase as a result of these cuts.
Just for some context, JRI invests in a mixed portfolio containing exposure to ‘real assets’. This can be defined as sectors such as tangible assets that hold real-world value such as real estate, infrastructure-based businesses like utilities, and natural resources which all serve essential functions to the human experience and contribute to our well-being. A fund like this makes sense if you believe in the long-term growth and improvement of infrastructure across the US. JRI operates as a closed end fund and utilizes its diverse exposure to real assets to generate a high yield of 12.5%. This makes JRI an attractive investment for income oriented investors.
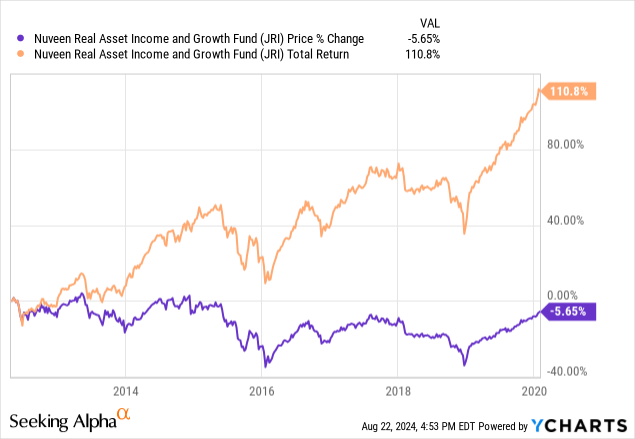
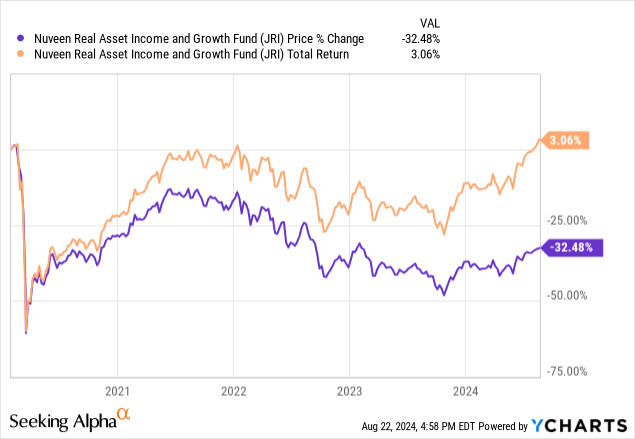
The fund has an inception dating back to 2012 and before the pandemic it maintained a consistent price range. We can see that from inception up until February 1st of 2020, the price ultimately declined by a modest 5.6% while the total return surpassed 110%. Following the pandemic, the price was heavily suppressed by higher market volatility and the weight of a decade high federal funds rate. We can see the shift in consistency following the pandemic with the price retracting by over 32% and the total return barely squeezing in a positive return. For reference, the graph below is dated from February 1st of 2020 to present day. I believe that this drop has presented an opportune time to accumulate shares for both existing and newer shareholders.
JRI sports an expense ratio of 1.37% and has assets under management totaling $511M according to the latest fact sheet. The fund has a primary goal of generating current income, with a secondary objective of providing long term capital appreciation. However, the fund does this by investing in assets that may be rated below investment grade, so let’s first start by assessing JRI’s portfolio strategy.
Portfolio Strategy
JRI’s exposure to real assets include a majority allocation towards pipelines, accounting for 21% of assets. This is followed by exposure to electric utilities making up 19.7% of assets. The remaining portion of the fund is exposed to varying weights across a mix of infrastructure or real estate related holdings that can all benefit from future interest rate cuts. The businesses that are part of JRI’s portfolio are typically very reliant on access to debt capital that can fund operational growth.
For instance, pipeline businesses may depend on access to affordable debt as a way to expand their roadmap coverage of pipelines across the country through new construction and development. Similarly, electric utilities may depend on access to debt so they can fund development of new power plants and improve efficiencies. As a result, these industries haven’t been able to efficiently grow operations in the current environment. Still, diverse nature of the fund helps mitigate some of these risks and can offset these negative impacts.
Nuveen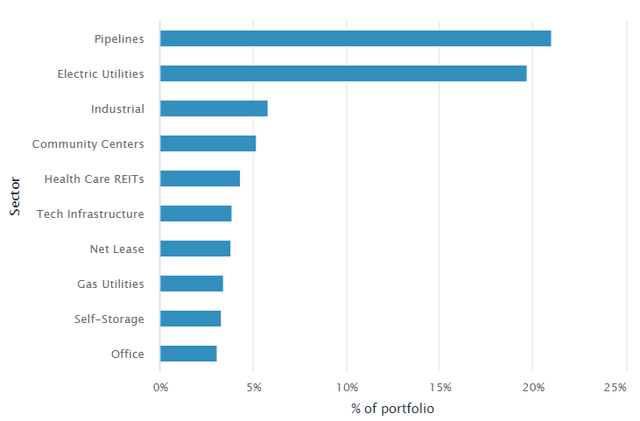
Something that introduces a bit more risk is the fact that JRI makes these investments into companies that may have unfavorable credit ratings. Up to 40% of the fund’s assets may be in debt securities that are rated below investment grade. In addition, the fund also utilizes a bit of leverage to help boost returns when possible. As of the latest fact sheet, the effective leverage rate sits at 29.6% with an average cost of 6%. Therefore, future interest rate cuts would also make the use of leverage less expense and yield greater results for JRI.
JRI maintains exposure to about 397 different individual holdings across these sectors. As of now, none of the positions account for more than a 2% weight to total assets. The largest position is currently in Enbridge (ENB) which has a weight of 1.7%. The fund maintains a majority weight of 64.6% to the US as well as a sizeable exposure to Canada, the United Kingdom, Australia, and Italy. The top 5 holdings are as follows:
- Enbridge (ENB) – 1.7%
- ONEOK, Inc. (OKE) – 1.5%
- Pembina Pipeline (PBA) – 1.3%
- Kinder Morgan (KMI) – 1.2%
- Healthpeak Properties (DOC) – 1.1%
Lastly, the fund also utilizes a call option strategy against its underlying holdings as a way to generate higher levels of income through the premiums collected. This can help boost total return through the distributions, but it also has the downside of capping the upside price movement that can be captured. This is one of the contributing factors to why JRI has not experienced any meaningful upside price increases over the last decade. If JRI writes an option with a strike price of $50 on an underlying asset trading at $48, any price increases in the underlying asset above the strike price are not recognized by the fund. So while some price gains can be captured, the majority of it is not.
Valuation & Flawed NAV
Since JRI operates as a closed end fund, the price can vary from the underlying value of its net assets. The price currently trades at a discount to NAV of 8.3%, but this is following the recent price spike. We can see that only a month prior, the price traded closer to a discount to NAV of 15%. However, I still believe that the current discount level is attractive when you take the benefits of interest rate cuts into consideration. For reference, the fund has traded at an average discount to NAV closer to 12% over the last three-year period. When interest rates were cut to near zero levels in response to the pandemic, the discount got as low as 5% at the fund’s price peak of 2021.
CEF Data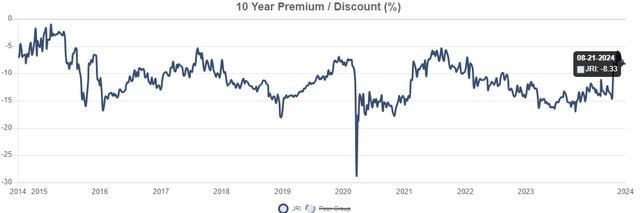
When comparing JRI’s price to the federal funds rate, we can see the recent inverse relationship. The price of JRI seemed to rapidly grow when rates were cut to near zero levels, and also quickly retracted as interest rates were aggressively hiked throughout 2022 and 2023. Therefore, it isn’t that unreasonable to expect the price to gain some upward momentum when interest rates finally do get cut. As of the latest update, the Fed seems to agree that interest rate cuts are likely in September.
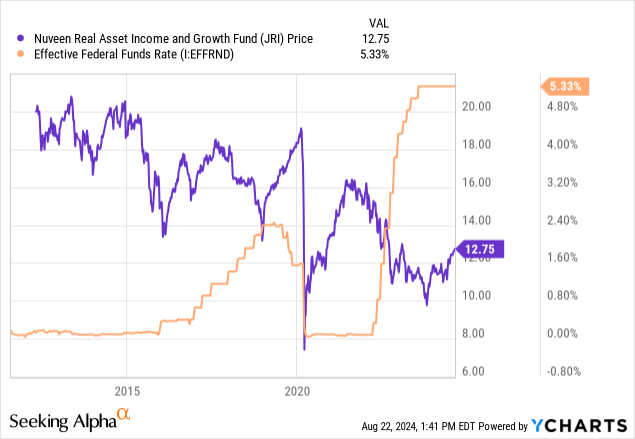
Lower interest rates would provide access to more affordable debt, and current borrowers of debt within JRI’s portfolio may get some relief as the cost of interest payments decrease. This can improve overall profitability and help boost valuations as companies shift from a more defensive stance back to the pursuit of growth. While cuts in interest rates can serve as a positive price catalyst, I remain a bit cautious due to the flawed NAV growth over the fund’s history.
I searched through the most recent 2023 annual report and found the below table. We can see that the NAV back in 2019 was $20.04 per share. Since then, it has deteriorated down to $13.69 per share. While the periods between 2022 to the present can be attributed to the periods of higher interest rates, I fear that there is a larger issue going on here. The annual distribution from 2023 amounted to $1.08 per share, but I feel that it may need to be reduced in order to promote more efficient NAV growth. In fact, it seems like the distribution has steadily decreased year over year since 2019. It started at an annual amount of $1.29 per share and has since fallen down to $1.08 per share.
JRI Annual Report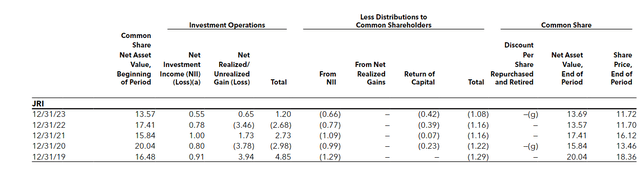
When a closed end fund’s price consistently deteriorates over a long period of time, it typically means two things. Either the fund performance is consistently poor or the distribution is too high, and the earnings do not cover it. For 2023 the net investment income landed at $0.55 per share and realized gains were $0.65 per share. This results in a net growth in investment operations of $1.20. While this did cover the distribution, the fund’s prior year performance was weak and amounted to an overall loss of -$2.68 per share.
In addition, the fund relies on the use of return of capital to help fund these distributions. I typically do not have issues with the use of return of capital, especially when the fund implements an option strategy. However, the use of ROC only accelerates the issue of a deteriorating NAV when the fund’s net investment income and realized gains aren’t enough to cover the distribution in the first place. It can be a bit difficult to decipher what portions of ROC are harmful here because some of the underlying holdings of JRI simply use ROC as part of their own distributions based on their business structures. This is common for pipelines and companies that operate as master limited partnerships.
The fund seems to be at the whim of general market conditions when using 2021’s performance as a reference. In 2021, the total investment growth through a combination of NII and net realized gains amounted to $2.73 per share, and this was attributed to the market’s strong performance that year. Similarly, when the market dropped hard in 2020, so did JRI’s NAV as the fund experienced large NII and realized losses within. Seems like JRI relies on bull markets to reduce impactful growth to its NAV, which means that the fund is pretty one-sided and doesn’t offer any defensive benefits. As much as I want to like this fund, this failure to soften the blow of market downturns makes it hard to recommend.
Dividend
As of the most recently declared monthly dividend of $0.1335 per share, the current dividend yield sits at 12.5%. As mentioned, the annual dividend has been steadily decreased year over year, but it looks like the course may be reversing. At the moment, the annual payout for 2024 is on track to surpass the prior year’s payout. Looking at the most recent section 19a notice reveals that approximately 54% of the distribution is being funded from net investment income, while the remaining 46% is made up from the use of return of capital.
Despite the decreasing dividend payouts, long-term shareholders were still able to collect high levels of income from JRI through continued investment and reinvestment of distributions. While there may be better choices out there, JRI has succeeded in serving its purpose as an income focused holding. To help visualize this, I ran a back test of an original investment of $10,000 at the start of 2015. This assumption includes an ongoing monthly investment of $500 in addition to all distributions received being reinvested back into JRI to accumulate more shares.
Portfolio Visualizer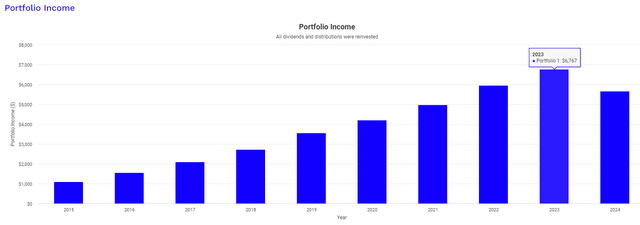
The blue bars represent the level of income received over each respective year. In year 1 of your investment, you would have received $1,102. Fast forwarding to the full year of 2023, your annual income would have grown to $6,767 despite all of the distribution reductions. However, it’s important to note that since portions of these distributions are driven by net investment income, the dividends received are classified as ordinary. Ordinary dividends have less favorable tax consequences compared to the qualified dividends that you’d receive from more traditional ETFs.
Vulnerability
JRI’s exposure may be diverse in nature, but it should be emphasized that it mains exposure to a large percentage of investments with credit ratings that are below investment grade. Typically, anything rated BB and below is considered below investment grade. As we can see, 34.1% of their portfolio contains BB rated debt and 8% B rated debt.
Businesses with these credit ratings usually have weaker balance sheets that may be more vulnerable to these interest rate fluctuations. Therefore, times where rates are inflated may cause a higher level of defaults within. This can further drag down of the NAV and contribute to losses in NII per share.
Nuveen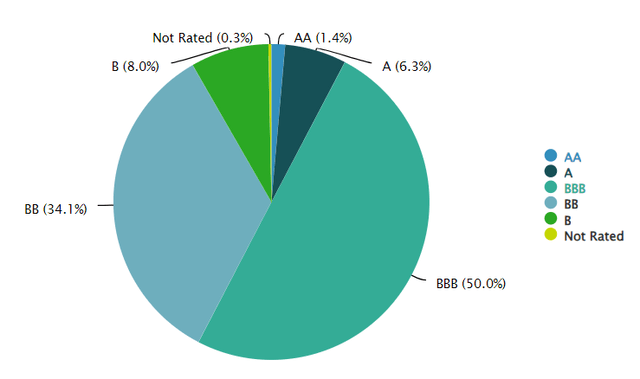
Not only would this make JRI’s portfolio more sensitive to prolonged periods of elevated interest rates, but it may cause some vulnerabilities to different economic shifts. For instance, companies with lower credit ratings may also have less of a cash buffer to help navigate headwinds such as slower sales. For example, the unemployment rate has steadily increased over the last twelve months and now sits at 4.3%. If this unemployment rate continues to move upward, this may cause a shift in consumer spending as households start to cut back on expenses in an effort to save money. This could result in lowered demand for real estate, reduced traffic and usage within the infrastructure sector, and even cut backs on the levels of demand for energy.
Takeaway
In conclusion, JRI remains an interesting fund with exposure to real assets related to real estate and infrastructure. Future interest rates can serve as a catalyst for these sectors and help JRI grow over the next few years. However, the fund’s performance so far has not been impressive. The NAV continues to deteriorate over time, and I believe that the distribution rate may be a contributing factor. While the high dividend yield of 12.5% is attractive for income investors, the fund’s performance seems a bit inconsistent. Although a combination of net investment income and realized gains were enough to cover the distribution in 2023, prior years were not so strong. JRI seems really depend on bullish market conditions to lock in positive NAV growth, as it has not seemed to hold up well in downturns. Therefore, I rate JRI as a hold for now to see how it improves over the course of interest rate cuts.
Credit: Source link