

We Are
Introduction
In my income portfolio, I hold both the Janus Henderson AAA CLO ETF (NYSEARCA:JAAA) and the Janus Henderson B-BBB CLO ETF (BATS:JBBB) as my “pure play” exposure to CLOs. While AAA CLOs are about 60% of the CLO market, investors should not underestimate how much risk the lower 40% of the market can offer.
I am overweight higher credit because of its continued strength in the face of rising rates, relatively low default rates, and consistent performance as an uncorrelated income-producing asset.
Brief Overview
If you’re very knowledgeable about CLOs, feel free to skip to the next heading.
Collateralized loan obligations, risky business loans sold in large packages of 150-250 and across “tranches,” or payout-tiers from AAA-B, in the event of default in these risky loans, have taken the income investing world by storm since 2020.
Figure 1, below, shows several of the largest CLO ETFs’ rapid rise in AUM since their launches across the last three years.
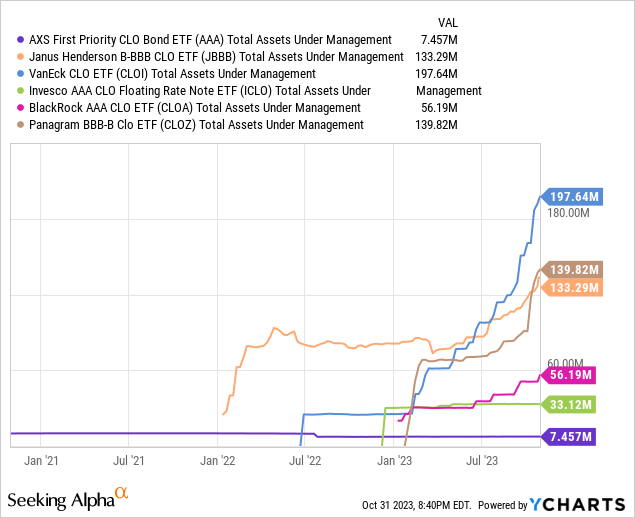
Note that I left out the leading name in the title of the article, the Janus Henderson AAA CLO ETF (JAAA), and that’s because it has grown so massively and so fast that it needed its own chart. Figure 2, below, is proof of this.
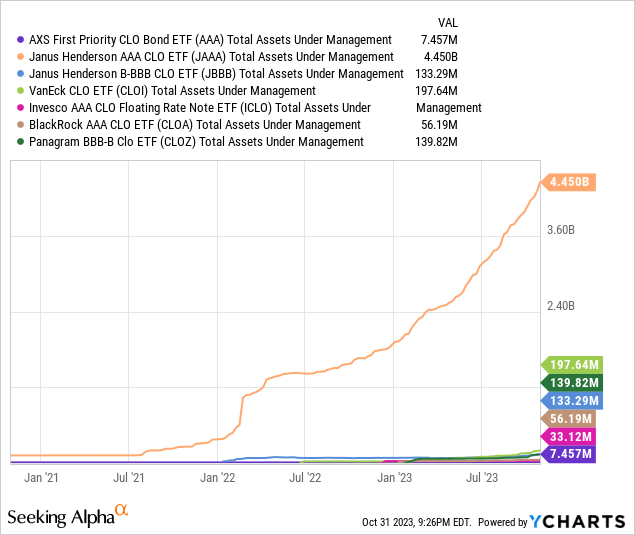
Notice that each of these has its own strategies, some investing in only certain tranches or across several tranches. The tranches are set up with AAA as the largest, comprising about 60% of the CLO itself, and then the tranches claim smaller and smaller shares of the pool as they accept more risk for higher yields.
Figure 3 (Oaktree Capital)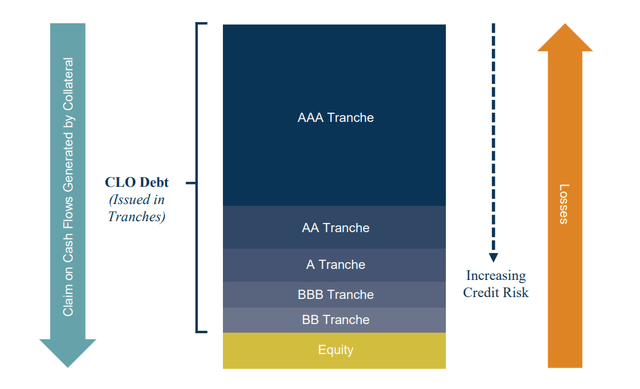
The loans packaged into CLOs are gathered from the leveraged loan market, syndicates of banks that lend to private companies that are unrated or whose ratings are below investment grade. The typical rates are floating rates at the Secured Overnight Financing Rate, SOFR (currently 5.31%), + 200-700bp. Here’s what the flow of capital looks like in a “typical” deal.
Figure 4 (Guggenheim Investments)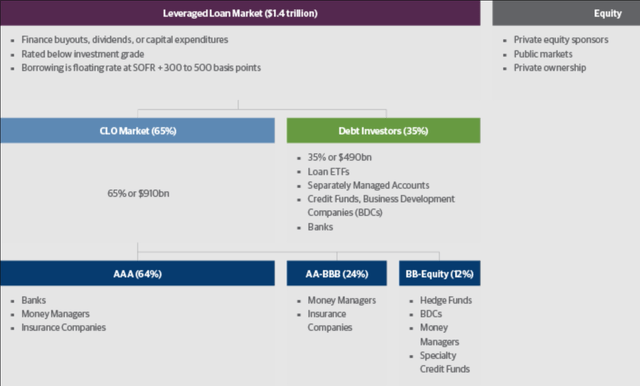
The Funds
| ETF | JAAA | JBBB |
| Price | $50.22 | $47.04 |
| Dividend Yield | 6.66% | 8.56% |
| Holdings | 205 | 76 |
| Effective Duration | 0.05yr | -0.09yr |
| Volatility | 1.65% | 5.15% |
| Beta | 0.0021 | 0.0173 |
| Expense Ratio | 0.22% | 0.50% |
| 30-Day Trading Volume | 48,513,323.52 | 1,881,882.24 |
| AUM | $4.46B | $133.27M |
As per Janus Henderson:
JAAA:
“An ETF investing in high-quality CLOs which seeks to deliver investors risk-managed access to an asset class that may provide consistent risk-adjusted returns and low correlation to traditional fixed income asset classes while exhibiting low volatility with low downgrade risk.
[They are] a robust asset class during uncertain times, AAA-rated CLOs have endured through the Global Financial Crisis and the COVID-19 pandemic, eliciting growth in the CLO market.”
JBBB:
“An ETF with floating rate exposure to CLOs rated from B to BBB and seeking to deliver investors access to securities with low default risk, low correlations to traditional fixed income asset classes and yield potential.
B to BBB-rated CLOs may help diversify a traditional fixed income portfolio. Floating-rate coupons can help limit the impact during periods of rising rates.“
Both funds hold CLOs directly while investing in their respective tranches. The idea behind investing in CLOs via these ETFs is that they provide broad exposure across the entire asset class, further providing a layer of diversity to shield more idiosyncratic credit risk, and the risk of individual borrowers defaulting on a loan for non-systemic or structural reasons.
Performance
Now that we understand what’s under the hood comes the important question: how have they actually done? Low/no duration credit favors rising rate environments, so we should expect to see some out-performance over traditional fixed-income assets.
Figure 5, below, shows the total return for both JAAA and JBBB against several passive index ETFs used as popular benchmarks. This first benchmark is constrained a bit because of JBBB’s short tenure on the market. Figure 6 takes a look at a longer timeline without JBBB.
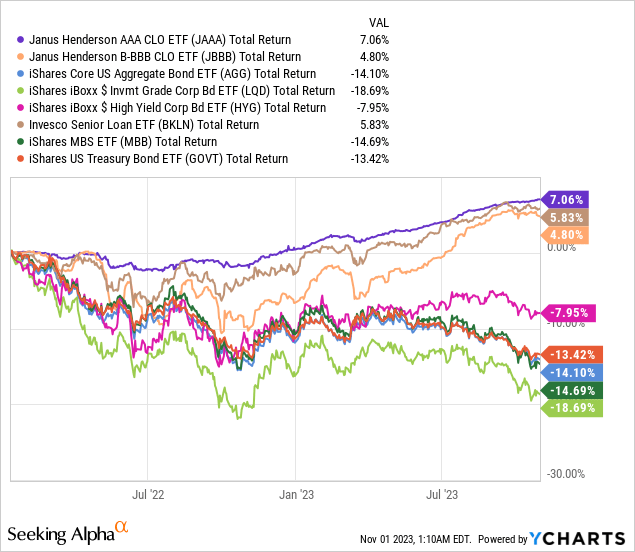
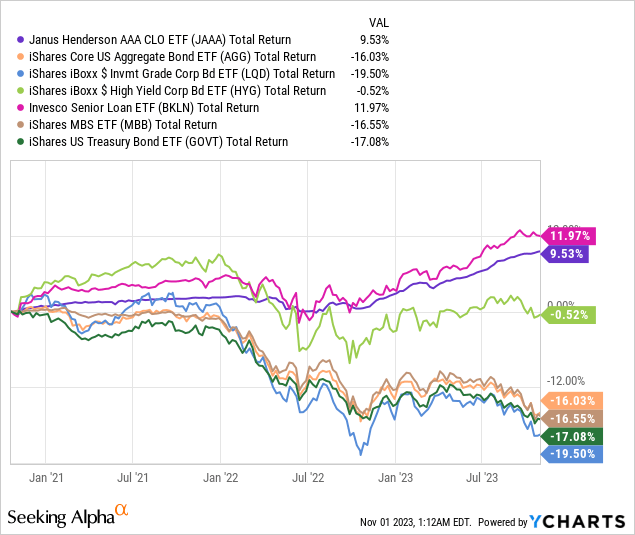
Out-performance across the board, delivering on the promise of excess returns over liquid corporate bonds (LQD), and junk bonds (HYG), but coming under leveraged bank loans (BKLN), the highest point in the corporate stack.
Lower Credit Provides Yield
Spreads in lower credit CLO tranches have climbed very high, at 950+bp on the highest end. This is double the spread of leveraged loans as a broad category and high-yield bonds. Note the gap in the spread between BB and BBB, and the gap between AAA CLOs and investment-grade corporate bonds in Figure 8. A yield-to-worst of 20.30% on the BB tranche is nothing to sneeze at and is incredibly tempting for investors seeking high returns without equity-like risk.
When comparing BBB-B CLOs to comparable fixed income products like high-yield bonds or leveraged bank loans, we see a remarkable increase in spread. There is a tighter, but still noticeable spread between AAA CLOs and IG Corporate bonds. Despite the realized default rates not justifying a higher spread, CLOs are still pricing in more risk than corporate bonds of similar credit quality. This spread makes CLOs attractive and justifies holding them over those corporate bonds.
Figure 8 (Van Eck)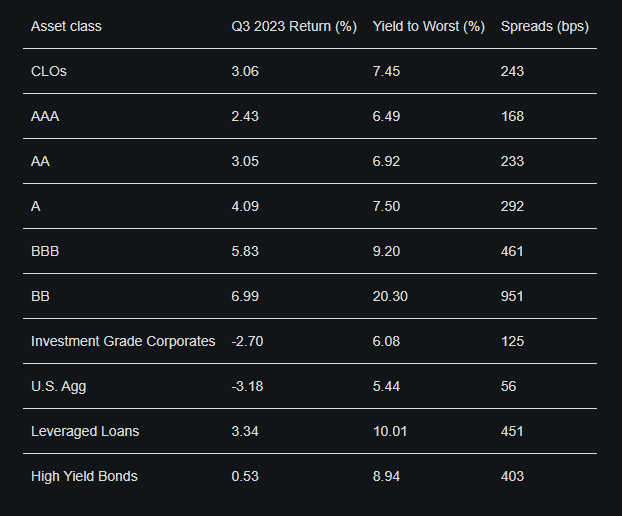
There is Still Pain
When we look at leveraged loan delinquency rates, we see a similar rate now to where we sat in 2015. Figure 9, below, shows leveraged loans’ averaged default rates going back to ’98. Note that even in 2020, the default rates never got above 5%, which is the pessimistic outcome from S&P Global analysts.
Figure 9 (S&P Global)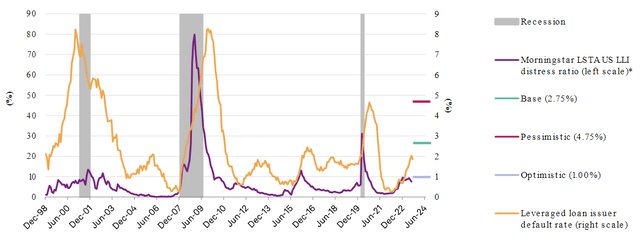
Speculative-grade debt defaults have been rising, in line with Figure 9. The rapid rise in rates in 2022 caused a spike in defaults, but notice the “lower highs,” in the chart, where total spec-grade defaults are starting to fall back toward a more normal range.
Figure 10 (S&P Global)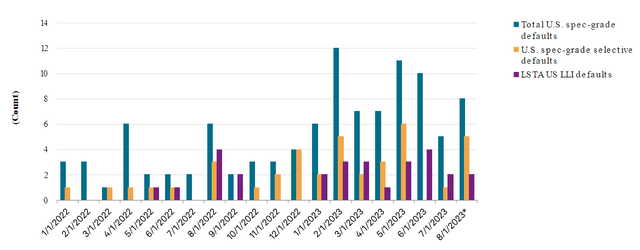
Default rates rising do add more risk to lower credit CLOs moving forward. I believe that the diversification shield brought on by the CLO structure, and double-layered with the ETF wrapper via JAAA & JBBB, will minimize this risk for investors and have made these worthwhile holdings in income portfolios.
While there is definitely a pain in the consumer market, noted in Figure 11 below, look at the divergence between consumer and commercial credit. We can see that business loans, which account for a considerable amount of all loans, have kept a steady default rate over the past five years and have not had the large spike that credit card debt has been experiencing.
Figure 11 (Federal Reserve Bank of St Louis (FRED))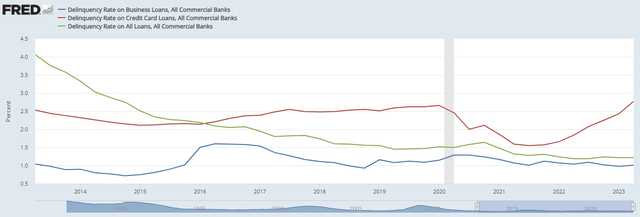
Leveraged loans have been climbing ahead of CLOs, and can be seen as a potential leading indicator for CLOs.
Figure 12 (JP Morgan)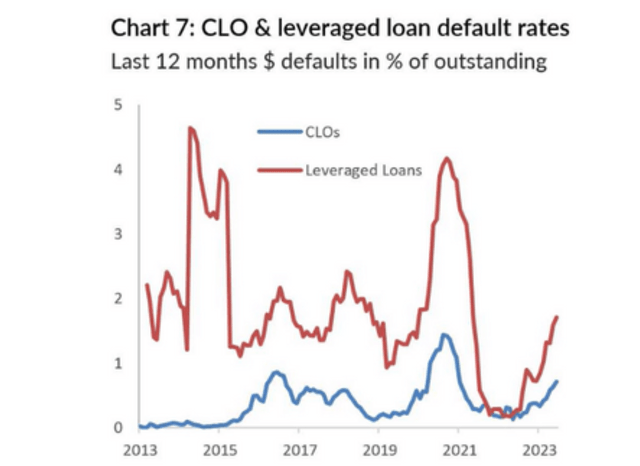
These risks should give investors pause and make them consider how much risk they are willing to take on. JAAA is far more risk-off than JBBB and weighting them in your portfolio can be tricky if you overestimate your risk tolerance.
Figure 13 (InvestSpy)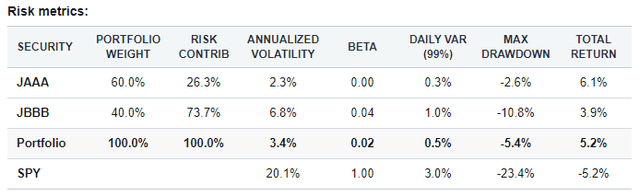
Note that JBBB carries 3x the risk of JAAA, has had almost 5x as deep of a drawdown, and exhibited a lower total return from inception to today. I still believe CLOs are the best way to get exposure to lower-quality credit, but I am overweight JAAA because it carries the better risk/return profile as of right now. Those rising rates might be too much of a risk for investors to take. I don’t believe it will pay off between the tranches, but still believe that CLOs will outperform corporates moving forward.
Allocation
In a traditional fixed-income portfolio, I would recommend an allocation of at least 10% to CLOs, if not upwards of 20-30%. Assuming you’d like to hold them at market weight, investors should hold JAAA and JBBB at a respective ratio of 6:4. They are remarkably less correlated than you might think.
Figure 14 (InvestSpy)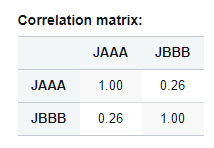
Consider that these funds could be a good replacement for leveraged bank loans like (BKLN), corporate bonds (LQD), high-yield bonds (HYG), or aggregate bond funds (AGG).
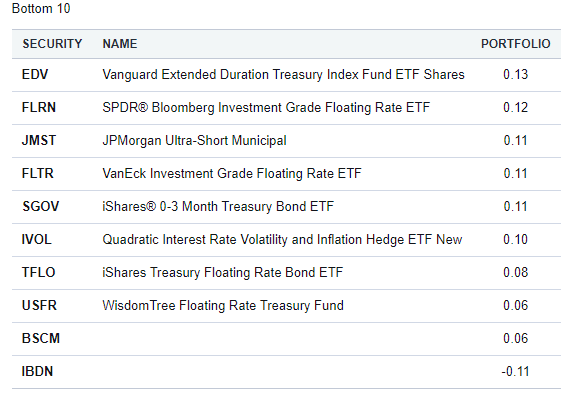
Note that these carry an odd correlation to other fixed-income instruments. The tables below, Figure 15 and Figure 16, might be helpful in determining if adding CLOs might expose you to more or less beta than you’re interested in. The tables show the correlation of a portfolio of 60% JAAA, and 40% JBBB.
Figure 15 (InvestSpy) Figure 16 (InvestSpy)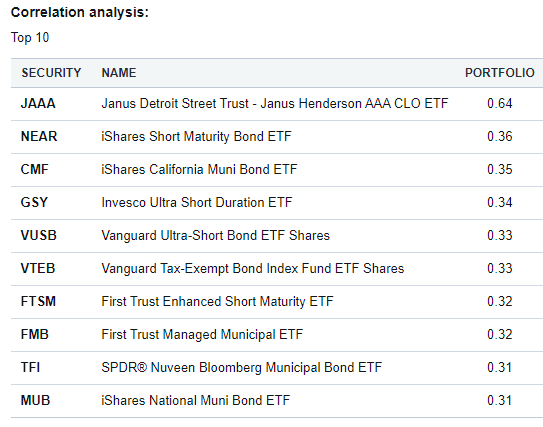
Conclusion
I believe that CLOs are going to be strong performers over the next cycle, especially with the higher-for-longer narrative being confirmed at the FOMC meeting last week.
AAA CLOs receive a higher rating from me than B-BBB CLOs due to their decreased risk compared to leveraged bank loans and high-yield corporate bonds, the overall strength in business loans we have seen throughout 2023, and will likely continue through 2024.
Investors should be wary of the realized volatility in lower credit CLOs, so I recommend no more than a total portfolio allocation to JBBB of 10% and no more than 30% to JAAA.
Credit: Source link