

svetikd
J.Jill (NYSE:JILL) retails women’s apparel in the United States. The company offers casual wear, athletic wear, footwear, and accessories among its offering. The company currently sells through 245 retail stores and the company’s website. After an IPO in 2017, Jill’s financial performance hasn’t impressed investors – since, the stock has lost nearly half of its value despite a rally beginning in 2021:
Stock Chart From IPO (Seeking Alpha)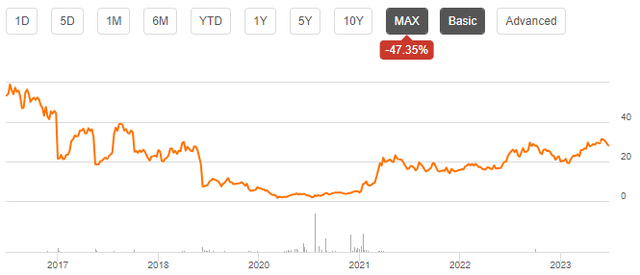
Financials – A Clear Focus on Profitable Retail Stores
Jill’s revenues grew at a CAGR of 7.2% from FY2013 to FY2019. After FY2019, the company’s revenues struggled largely due to the pandemic, and the revenues still haven’t recovered as current trailing revenues are 12.8% below the FY2019 level.
Author’s Calculation Using Seeking Alpha Data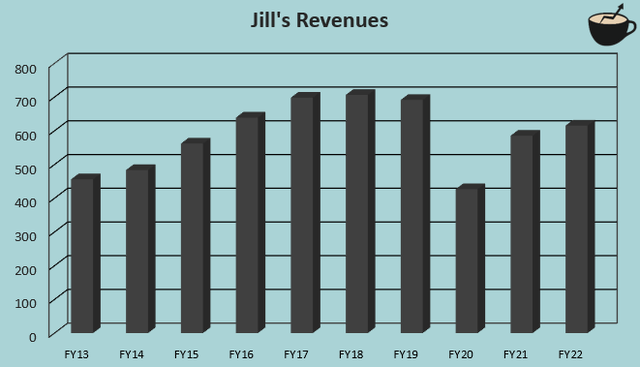
The lower sales level is currently being partly attributed to a weak macroeconomic sentiment, but the overwhelming majority of the lower sales level is due to Jill’s close-downs of retail stores – after Q4/FY2019, Jill had 287 open retail stores according to the quarter’s earnings call, compared with the 14.6% lower current figure of 245 – per-store sales have remained relatively flat when comparing the FY2019 figures to current ones, partly disturbed by a weak economy but boosted by inflation in recent years.
I believe that the close-downs have been a great move from Jill. Demonstrating the importance, Jill’s margins have risen to a new level after the store closings. The company had an average EBIT margin of 7.7% from FY2013 to FY2019 with a very weak FY2019 EBIT margin of 3.0%, with the margin rising to 13.0% in FY2022:
Author’s Calculation Using Seeking Alpha Data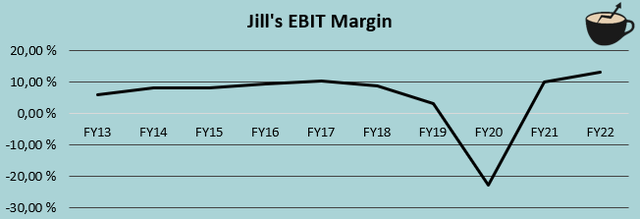
In total, the higher margin level has made Jill’s operating income higher than prior to the pandemic, despite a lower number of retail stores. In addition, the closedown has freed significant capital, as inventories have gone down from $72.6 million at the end of FY2019 to a current figure of $56.7 million.
Reported Q3 Results
Jill reported its Q3 earnings on the 5th of December. The company had revenues of $150.1 million, compared to analysts’ consensus estimate of $145.8 million – the reported sales were modestly above expectations, and were near flat year-over-year after a reported 2.9% revenue decline in Q2. The greater-than-expected sales are in my opinion a very welcome sign, as Jill’s revenue declines start to turn back to slight growth.
Better than the revenue surprise, Jill reported a normalized EPS of $0.78 compared to an estimate of $0.61. Still, the reported EPS is mostly in line with the previous year’s EPS of $0.77. The good earnings surprise came as a result of Jill’s margin resilience against expected margin deterioration – in the company’s Q3 earnings call, Jill attributes the margin performance to lower promotions and higher full-price sales, increasing the company’s gross margin by 1.9 percentage points year-over-year, negating the effects of inflation in SG&A. Also, Jill’s assortment was welcomed positively, contributing to the strong performance against weak expectations.
Still, investors should be cautious about upcoming quarters; Jill communicated in the earnings call that the end of Q3 and start of Q4 were weak in terms of revenues. In addition, Jill communicated the company’s outlook for Q4, expecting flat revenues and an EBITDA of $11 million to $13 million, compared to a previous year EBITDA of $15.1 million; margins seem to be taking a hit a quarter late to analysts’ expectations, if the guidance isn’t exceeded. The guidance seems to have come as a negative surprise, taking shine away from the stronger-than-expected Q3 margins.
Valuation
Jill doesn’t sport a very high stock price – currently, the stock trades at a forward P/E of 10.0 after a turbulent earnings and stock price history:
Historical Forward P/E (TIKR)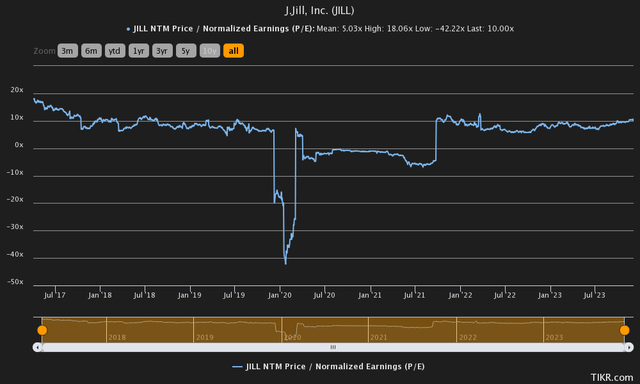
The price seems reasonable for a company such as Jill. The company doesn’t seem to have great growth ambitions, and it operates in a mature industry. With a DCF model that follows my assumptions, the stock seems undervalued, though.
In my DCF model, I estimate Jill’s revenues to decline by 2% in FY2023, in line with the Q4 guidance. Afterwards, I estimate a growth of 4% in FY2024 as the sales environment normalizes. Afterwards, I estimate a stable revenue growth of 2%, in pace with a fair inflation expectation. The estimate refers to a scenario where Jill’s store count stays mostly flat going forward, and the company can’t find unprofitable stores to close down, but does maintain a good level of performance in current stores. For the company’s margins, I don’t see significant pressures to either side. After a FY2023 EBIT margin of 13.1%, I estimate very slight margin expansion in FY2024 into a margin of 13.4% as the sales level in stores normalizes and the new POS system’s cost cuts account for the full year. The company has a mostly good cash flow conversion with modest needs for capital expenditures.
With the mentioned estimates along with a cost of capital of 9.21%, the DCF model estimates Jill’s fair value at $35.70, around 30% above the stock price at the time of writing. The stock seems to be priced for a deteriorating earnings level, which I believe to be unlikely – the store close-downs in recent years have in my opinion been a great strategic move instead of a threat for the entire business, which markets don’t seem to support as a thesis.
DCF Model (Author’s Calculation)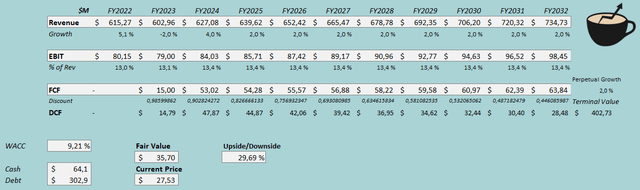
The used weighed average cost of capital is derived from a capital asset pricing model:
CAPM (Author’s Calculation)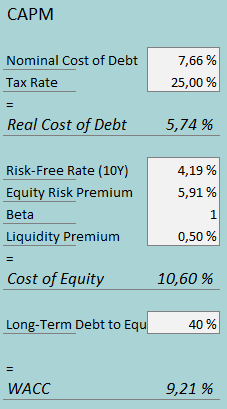
In the most recent reported quarter, Jill had $5.8 million in interest expenses. With the company’s amount of interest-bearing debt at the end of Q3, Jill’s annualized interest rate comes up to 7.66%. I believe a good part of Jill’s interest expenses are related to operating leases, which I usually exclude from debt in the DCF model and CAPM due to their operational nature. As the interest expenses can’t be separated easily, though, I consider leases as interest-bearing debt for Jill. Due to the leases being included as debt, I expect quite a high long-term debt-to-equity ratio of 40%.
For the risk-free rate on the cost of equity side, I use the United States’ 10-year bond yield of 4.19%. The equity risk premium of 5.91% is Professor Aswath Damodaran’s latest estimate for the United States, made in July. Yahoo Finance estimates Jill’s beta at a figure of 1.00. Finally, I add a small liquidity premium of 0.5%, crafting a cost of equity of 10.60% and a WACC of 9.21%.
Takeaway
Jill reported a flat year-over-year financial performance in Q3, but did guide for a weaker profitability in Q4. The company has closed down a good amount of its retail stores in recent years to improve profitability, which seems like a successful move so far as operating earnings are near all-time highs. The valuation seems to suggest that the store close-downs signal a weak brand and a weak future financial performance, which I don’t believe to be the most likely case. As my DCF model estimates upside for the stock, I believe that Jill’s significant stock rally in recent months should still have some room to continue. For the time being, I have a buy rating for the stock
Credit: Source link