
DaveAlan/iStock via Getty Images
Introduction
The iShares U.S. Basic Materials ETF (NYSEARCA:IYM), is a passively managed exchange-traded fund that tracks the Russell 1000 Basic Materials RIC 22.5/45 Capped Index. As per the fund’s prospectus:
“IYM is a straightforward large-cap sector fund that tracks a vanilla, market-cap-weighted index that provides exposure to the basic material industry of the US market, as classified by the ICB sector framework. Regulatory capping targets are applied at each quarterly rebalance such that single issuer weights are capped at 22.5% and the aggregate weight of all companies exceeding 4.5% weight is capped at 45%. Instead of replicating the index, the fund uses representative sampling to track the index and may also hold cash and cash equivalents, money market funds, and derivatives including futures, options and swap contracts up to 20% of the portfolio to maximize investment results. Prior to September 20, 2021, the fund tracked the Dow Jones U.S. Basic Materials Index.”
It primarily invests in mid to large market capitalization firms within the Basic Materials sector listed in the United States. However, many of its company holdings have worldwide operations. This includes firms within the metals and mining, chemical, construction materials, paper and forest products, and containers and packaging industries.
When it comes to using this ETF within a portfolio of ETFs, it is difficult to see where it fits in. The basic materials sector is among the smallest in the S&P 500, and the outperforms the market in specific circumstances. However, even when those circumstances arise, other specific industries tend to outperform the market even more. Additionally, other basic materials funds are superior to IYM on several important metrics including fees and liquidity, further reducing the need to utilize IYM.
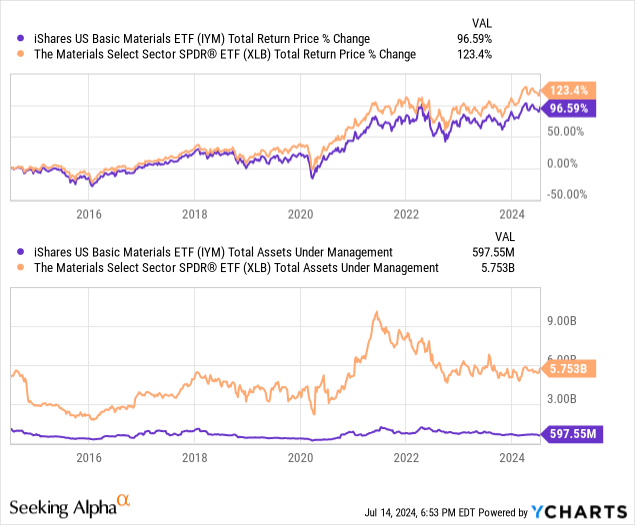
IYM has had a chance to outperform the category leader with 10x as many assets, the Materials Select Sector SPDR® Fund ETF (XLB) for a long time. It has been unable to do so consistently. That may in part be due to the different weighting system used by IYM’s index, which is based on the Russell 1000 and not the S&P 500’s basic materials component set of stocks. Small-cap stocks have dragged returns across the US sectors over the past several years, and as that underperformance shows no signs of reversing, IYM is likely to remain at best a runner-up for investors.
etfrc.com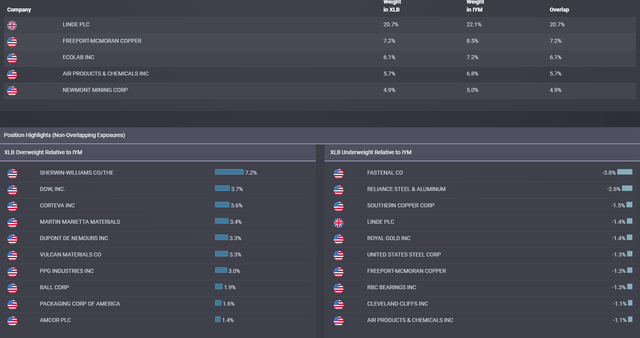
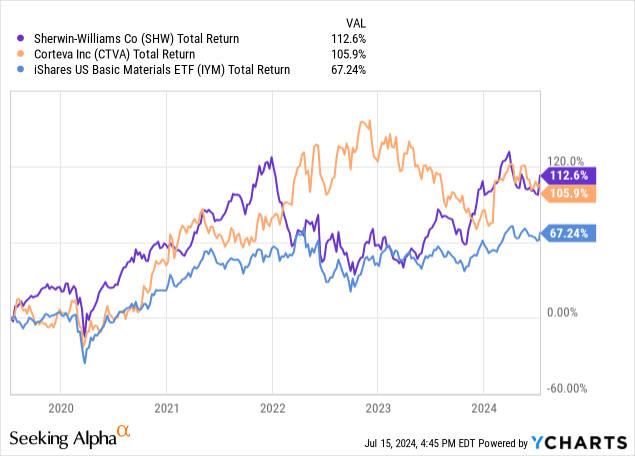
The graphic above shows that IYM is underweighting some past large-cap leaders, 2 of which are pictured in the graph below. These are just 2 examples of where even modest differences in weightings between indexes can produce very different returns for ETFs tracking those indexes.
When Basic Materials Perform the Best
The economic situation in which basic materials tend to perform the best is during a period of strong global real GDP growth, and elevated inflation. Real GDP growth leads to widespread investment often in the form of increasing industrial capacity through building factories, and other types of investment, which require large amounts of basic materials. Elevated inflation means that basic materials firms can increase their prices, and since they are at the beginning of the value chain, they tend to be able to pass on more cost increases than other sectors.
Although the current uncertain inflationary environment is great for basic materials firms, it might make more sense to consider mining stocks in gold and silver, which are a subset of what IWM and XLB own. Here is a recent example.
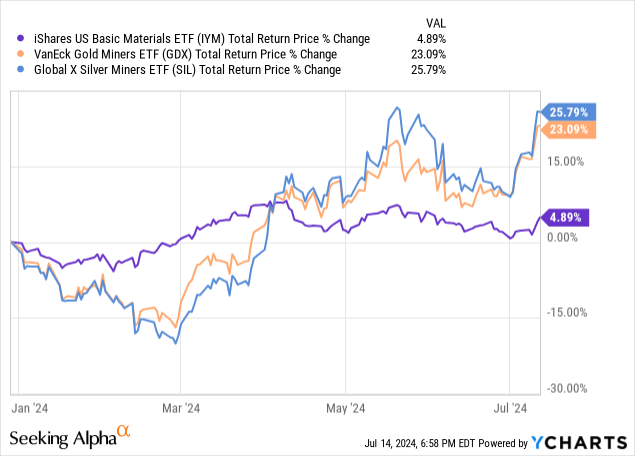
This is not to say that IYM is of no use. Any market sector that rises and falls as shown below, over 3-month periods, can be useful to so-called sector rotation strategies using ETFs. Gold and silver miners are much more volatile than the sector in total, so there is a possibly smoother path here.
Holdings Analysis
Seeking Alpha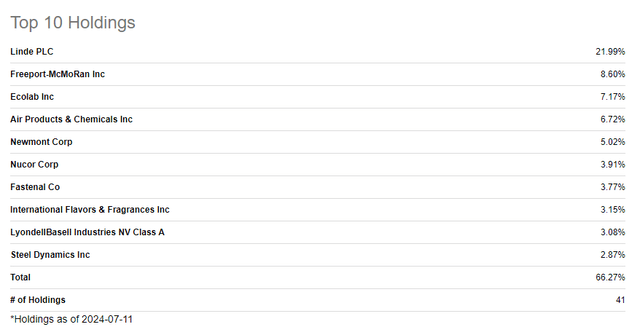
The fund has a huge concentration in one holding, Linde plc (LIN), a provider of industrial gases that are used for a variety of purposes throughout different industries in their processes to create products such as steel, glass, cement, and paper. LIN is headquartered in Germany, but after a merger with a US company, is now only listed on the New York Stock Exchange. However, it should be noted that half of its sales come from outside the US. It is by far the largest basic materials company in the world, with a market capitalization of over $200 billion.
IYM might be able to make a case for being a differentiated basic materials ETF, but its holdings allocation versus peer group leader XLB is too similar. As shown here, the names and position weights are not very different. And XLB packs its portfolio into 30 stocks, versus about 40 for IYM.
etf.com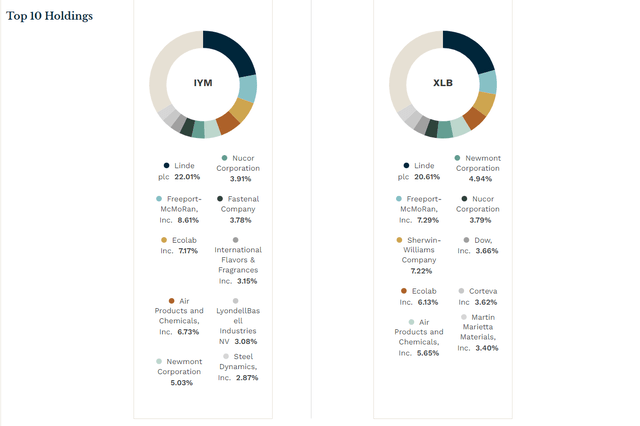
XLB, State Street’s basic materials ETF, and compares favorably to IYM on multiple fronts. In terms of fees, XLB’s expense ratio is only 0.09% versus 0.40% for IYM.
Less volatile recently
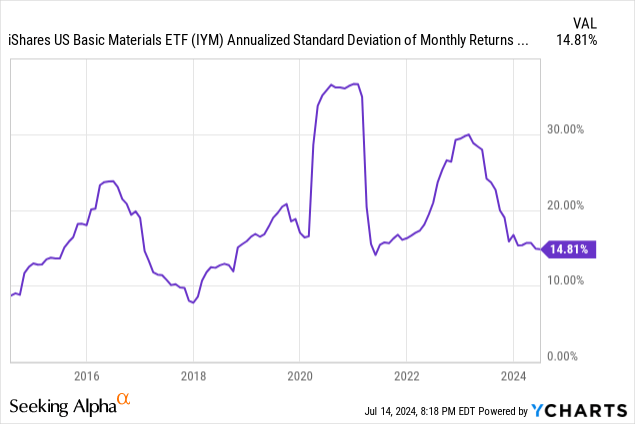
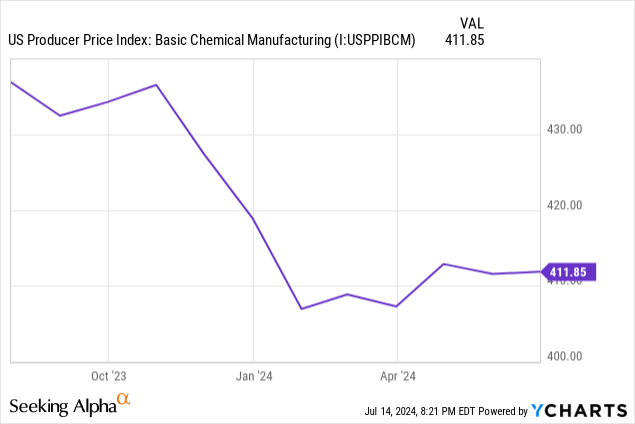
One thing that plays into IYM’s favor is that it currently sits at near its lowest standard deviation of the past decade. That might indicate that the stocks here have been ignored and that a period of higher volatility, accompanied by price increases in the stocks as gold, silver, and chemical prices rise, is possible. As the second chart shows below, chemical prices are in a trough.
Valuation
IYM trades at 23.5x trailing 12-month earnings. That is a discount to the S&P 500.
Ycharts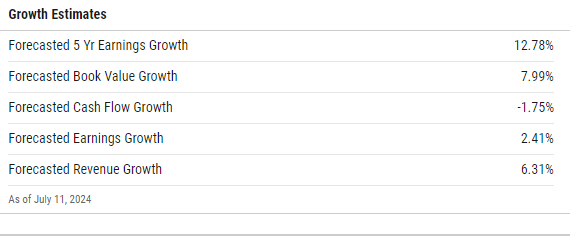
And since IYM’s portfolio currently projects 5-year earnings growth in double digits (see above table), that does not appear to be a sky-high multiple to us. But there’s not much yield here either, so again it is a matter of this ETF not doing enough to stand out.
etf.com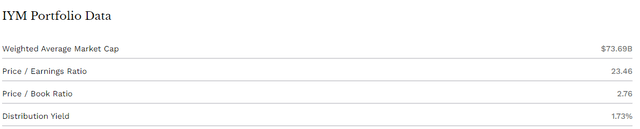
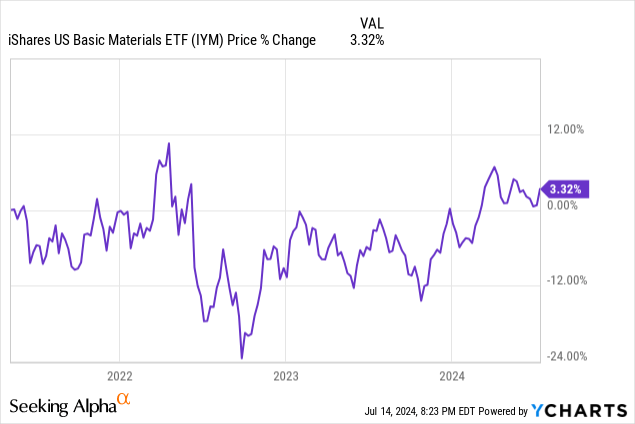
Finally, as shown in the chart above, the net return excluding the small dividend yield for IYM has been about flat since just over 3 years ago. One possibility is that, like so many parts of the market that have trailed big tech stocks, that these smaller sectors of the S&P 500 end up having these past few years being a time for investors to reset their views, and re-discover them as part of a broader market participation.
Conclusion
Although the basic materials sector has certain environments where it outperforms, it is possible to allocate to other assets that perform even better in those same environments. Furthermore, when considering an allocation to the materials sector, better options exist than IYM. Specifically XLB, due to its higher liquidity, lower fees, and better risk-adjusted performance. For these reasons, we rate IYM a sell.
Credit: Source link