
• bitcoinBitcoin(BTC)$81,261.000.48%
  • ethereumEthereum(ETH)$2,634.630.94%
  • tetherTether(USDT)$1.00-0.01%
  • binancecoinBNB(BNB)$762.210.07%
  • rippleXRP(XRP)$1.411.13%
  • usd-coinUSDC(USDC)$1.00-0.01%
  • solanaSolana(SOL)$111.07-1.49%
  • tronTRON(TRX)$0.3397840.44%
  • zcashZcash(ZEC)$1,471.76-6.29%
  • Figure HelocFigure Heloc(FIGR_HELOC)$1.02-1.43%
  • HyperliquidHyperliquid(HYPE)$92.00-0.63%
  • dogecoinDogecoin(DOGE)$0.0879030.29%
  • moneroMonero(XMR)$546.08-3.12%
  • whitebitWhiteBIT Coin(WBT)$82.91-0.13%
  • RainRain(RAIN)$0.0137542.90%
  • USDSUSDS(USDS)$1.00-0.02%
  • chainlinkChainlink(LINK)$12.431.66%
  • cardanoCardano(ADA)$0.2278891.58%
  • leo-tokenLEO Token(LEO)$8.90-0.09%
  • stellarStellar(XLM)$0.1966732.12%
  • uniswapUniswap(UNI)$8.66-2.12%
  • bitcoin-cashBitcoin Cash(BCH)$256.440.61%
  • Ethena USDeEthena USDe(USDE)$1.00-0.02%
  • nearNEAR Protocol(NEAR)$3.58-4.14%
  • daiDai(DAI)$1.000.02%
  • litecoinLitecoin(LTC)$58.090.38%
  • avalanche-2Avalanche(AVAX)$10.1423.39%
  • USD1USD1(USD1)$1.00-0.02%
  • CantonCanton(CC)$0.109411-1.78%
  • the-open-networkGram (prev. Toncoin)(GRAM)$1.380.61%
  • hedera-hashgraphHedera(HBAR)$0.0815913.05%
  • suiSui(SUI)$0.865.84%
  • MemeCoreMemeCore(M)$1.5115.23%
  • Global DollarGlobal Dollar(USDG)$1.00-0.01%
  • shiba-inuShiba Inu(SHIB)$0.0000061.05%
  • BittensorBittensor(TAO)$264.066.68%
  • crypto-com-chainCronos(CRO)$0.059523-0.36%
  • paypal-usdPayPal USD(PYUSD)$1.00-0.03%
  • tether-goldTether Gold(XAUT)$4,373.76-0.06%
  • Circle USYCCircle USYC(USYC)$1.140.00%
  • okbOKB(OKB)$117.751.17%
  • Ripple USDRipple USD(RLUSD)$1.000.00%
  • BlackRock USD Institutional Digital Liquidity FundBlackRock USD Institutional Digital Liquidity Fund(BUIDL)$1.000.00%
  • Ondo US Dollar YieldOndo US Dollar Yield(USDY)$1.15-0.29%
  • aaveAave(AAVE)$141.441.40%
  • AsterAster(ASTER)$0.76-0.68%
  • EthenaEthena(ENA)$0.20393020.90%
  • mantleMantle(MNT)$0.62-0.37%
  • OndoOndo(ONDO)$0.4205555.61%
  • Pump.funPump.fun(PUMP)$0.004248-0.54%
TradePoint.io
  • Main
  • AI & Technology
  • Stock Charts
  • Market & News
  • Business
  • Finance Tips
  • Trade Tube
  • Blog
  • Shop
No Result
View All Result
TradePoint.io
No Result
View All Result

It Turns Out That The Small-Cap Rally Was A Bad Dream

August 12, 2024
in Market & News
Reading Time: 4 mins read
A A
It Turns Out That The Small-Cap Rally Was A Bad Dream
ShareShareShareShareShare

gremlin/E+ via Getty Images

YOU MAY ALSO LIKE

‘We need some fresh thinking’ in Congress, says Democrat challenging Massachusetts incumbent

Moulton says he shares same progressive values as Markey but isn’t afraid to challenge establishment

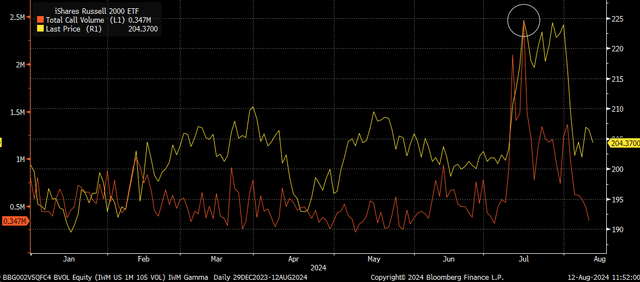
So much for the summer of the small-cap rally, which seemed to fizzle out faster than it started, literally. All it took was three days for the entire rally to vanish. The whole thing, it turns out, was just a massive illusion driven by an options market-created squeeze. An absolute nightmare.

Once call volume in the iShares Russell 2000 ETF (IWM) collapsed, there was no more fuel to send the group higher. That said, it probably isn’t by chance, either, that the IWM closing high came on the same day that call volume peaked.

IWM vs. Calls

Bloomberg

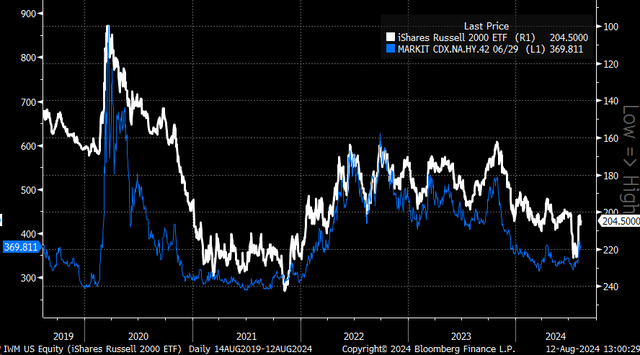
The other problem facing small caps currently is that credit spreads are rising. There tends to be a misconception that small caps benefit if rates on the long end of the curve are falling. Perhaps that is true, but that may only be the case if credit spreads aren’t rising at the same time. When long-end rates fall, accompanied by rising credit spreads, it sends a negative signal about the US economy.

When turning the price of the IWM upside down and then comparing it to the CDX high-yield CDS Index, we can see that the price movements of the IWM and CDS Index overlay nicely. They tend to move with one another. This means that small-cap stocks fall when the credit spread index is rising.

So, if we are at the point in the economic cycle where rates are falling due to deteriorating economic data and credit spreads are rising. As a result, one would not expect small caps to perform well. If economic data improves, then perhaps small caps will recover their losses.

IWM vs. Credit Spreads

Bloomberg

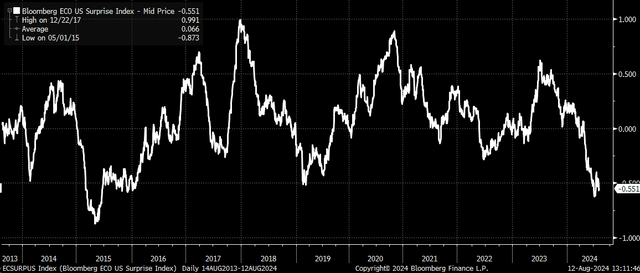
Even the performance of the regional banks has pulled back despite the yield curve continuing to steepen. Again, the reason is that economic data appears to be turning more sour, as noted by the Bloomberg Economic US surprise index, which fell to its lowest level since 2015.

The weak Bloomberg economic surprise index, coupled with the declining regional banks, could tell us that the yield curve is steepening. This is not because the market is anticipating the Fed cutting rates ahead of a soft landing, but perhaps because the Fed will be cutting rates due to a hard landing.

surprise index

Bloomberg

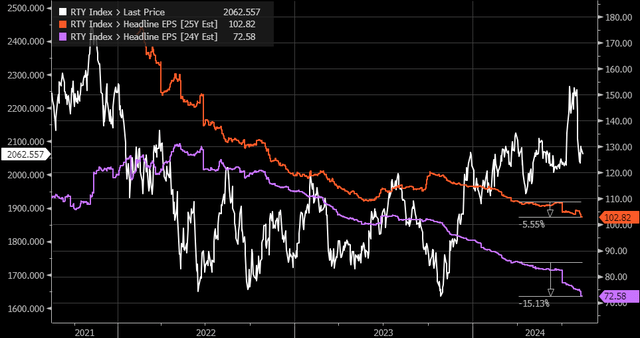
Additionally, earnings estimates for the Russell 2000 have fallen dramatically since March, more than 15% for 2024 and more than 5% for 2025. This isn’t a positive development, and the Russell 2000 has been moving against the falling earnings trend since the fall of 2023.

The falling earnings estimates suggest that the recent rally in small caps had something happening not due to fundamentals and perhaps had more to do with mechanical factors in the market.

Earnings

Bloomberg

So, as it turns out, the move higher in the small caps, at least on that first attempt, just appears to have been a fake-out driven by overambitious traders creating a squeeze across the entire index. It doesn’t mean that small caps can’t try to rally again at some point later this year; it just doesn’t seem that the time is now.

For now, it seems to have all been smoke and mirrors. It sometimes pays to understand what the mechanical force driving the market is to avoid these types of situations.

Join Reading The Markets

Reading the Markets helps readers cut through all the noise, delivering daily video and written market commentaries to prepare you for upcoming events.

We use a repeated and detailed process of watching the fundamental trends, technical charts, and options trading data. The process helps isolate and determine where a stock, sector, or market may be heading over various time frames.

Credit: Source link


ShareTweetSendSharePin

Related Posts

‘We need some fresh thinking’ in Congress, says Democrat challenging Massachusetts incumbent
Market & News

‘We need some fresh thinking’ in Congress, says Democrat challenging Massachusetts incumbent

September 19, 2026
Moulton says he shares same progressive values as Markey but isn’t afraid to challenge establishment
Market & News

Moulton says he shares same progressive values as Markey but isn’t afraid to challenge establishment

September 19, 2026
What the jury must consider while deciding Lindsay Clancy’s fate
Market & News

What the jury must consider while deciding Lindsay Clancy’s fate

September 19, 2026
Meet the Press NOW — September 1
Market & News

Meet the Press NOW — September 1

September 19, 2026
Next Post
Morning News NOW Full Broadcast – April 9

Morning News NOW Full Broadcast - April 9

Leave a Reply Cancel reply

Your email address will not be published. Required fields are marked *

Search

No Result
View All Result
Doctors fill CDC guidance void with new vaccine recommendations

Doctors fill CDC guidance void with new vaccine recommendations

September 18, 2026
Clancy’s lawyer says she has no anger toward anyone in trial

Clancy’s lawyer says she has no anger toward anyone in trial

September 15, 2026
Generac: Amazon Gives The Story More Credibility (NYSE:GNRC)

Generac: Amazon Gives The Story More Credibility (NYSE:GNRC)

September 18, 2026

About

Learn more

Our Services

Legal

Privacy Policy

Terms of Use

Bloggers

Learn more

Article Links

Contact

Advertise

Ask us anything

©2020- TradePoint.io - All rights reserved!

Tradepoint.io, being just a publishing and technology platform, is not a registered broker-dealer or investment adviser. So we do not provide investment advice. Rather, brokerage services are provided to clients of Tradepoint.io by independent SEC-registered broker-dealers and members of FINRA/SIPC. Every form of investing carries some risk and past performance is not a guarantee of future results. “Tradepoint.io“, “Instant Investing” and “My Trading Tools” are registered trademarks of Apperbuild, LLC.

This website is operated by Apperbuild, LLC. We have no link to any brokerage firm and we do not provide investment advice. Every information and resource we provide is solely for the education of our readers. © 2020 Apperbuild, LLC. All rights reserved.

No Result
View All Result
  • Main
  • AI & Technology
  • Stock Charts
  • Market & News
  • Business
  • Finance Tips
  • Trade Tube
  • Blog
  • Shop

© 2023 - TradePoint.io - All Rights Reserved!