

Adam Gault
I believe we are sitting at the cusp of literally world-changing forces and events. We will all be challenged to continually refresh our worldview to keep up with the pace of dislocation and transformation.
It’s highly likely that, if the analytical methodologies relied upon in this report remain valid under current circumstances and continue to perform as they have in the past, there will be at least a substantive correction to stock prices sometime soon.
On the other hand, it is possible that new forces and a new paradigm has already taken hold, for which there are not yet proper economic and technical measures and methodologies. Big-cap tech could simply continue to explode in anticipation of radical, world-changing technologies that grow productivity and economic value generation exponentially into the future.
My overall take is that the economic and technological revolution will unfold, and faster than most expect, but that there will be some turbulence in the nearer term as measured by the prices of many stocks.
— A Substantial Correction In Stock Prices Is Likely Coming Soon, June 17, 2024
In last month’s report, quoted above, I continued to lay out my analysis of the essential tensions in the current environment for US stocks. On the one hand, nearly infinite Debt Monetarist asset price inflation keeps stocks elevated without regard to fundamentals or technicals. On the other hand, the technical and fundamental environment seems to strongly demand a substantive correction before a further bull movement can proceed. This is all set within a paradigm-shifting technological revolution.
Here’s a snapshot of relative performance of various index ETFs since I issued my last report:
TheBullBear.com, TradingView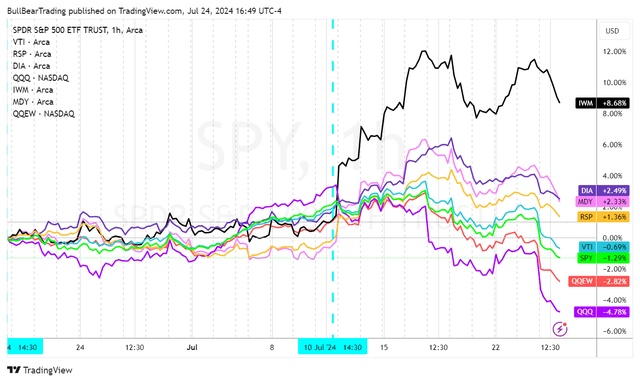
VTI, the total market ETF, is flat over the last month, while SPY and the tech stock ETFs have declined substantially.
Over the last few months, NYSEARCA:SPY and NASDAQ:QQQ have continued to levitate, while the rest of the market has stagnated or begun to decline. Such narrow breadth in a rally has always been the harbinger of an eventual correction.
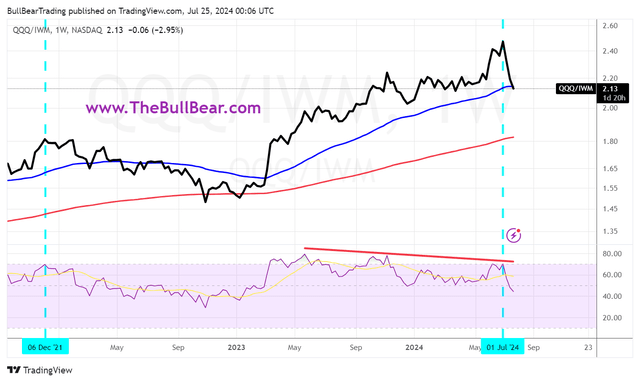
Very recently, the badly lagging Dow 30 Industrials (DJI) and the small capitalization Russell 2000 radically outperformed as the leading Big Tech stocks began to decline. Periods of negative correlation and underperformance of (QQQ) relative to IWM have been associated with pullbacks and corrections in recent history.
TheBullBear.com, TradingView TheBullBear.com, TradingView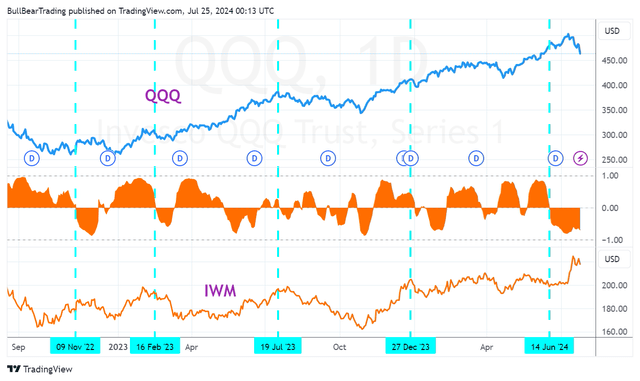
The (QQQ)/DIA ratio chart shows the same thing:
TheBullBear.com, TradingView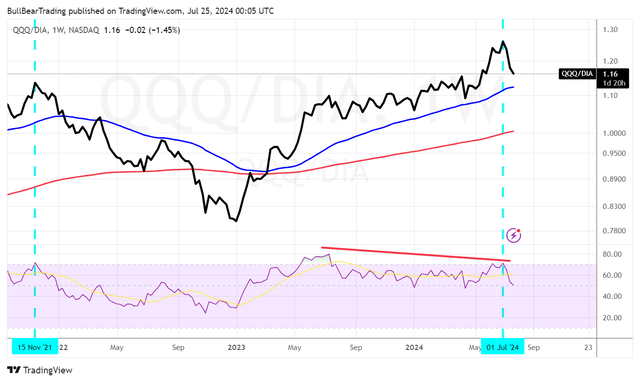
The big short-term movements into DIA and IWM were algorithmically driven short covering rallies, last gasp trading movements of an expired bull trend. There’s no “great rotation” out of tech into “value”. That’s an illusory narrative.
As we will see in this report, there are many reasons to think that we are now beginning a corrective movement that is analogous to the decline seen in 2022. In fact, it is most likely part of a larger scale pattern that began with the late 2021 top. In this case, we are starting the C-wave decline of an ABCDE sideways corrective pattern in the major indices. So we are about halfway through a period that should end up looking like a series of overlapping waves with an upwards bias. In technical parlance, a long term “running correction” that will set the basis for a more substantive future movement higher.
Let’s start with the daily charts.
Here’s SPY daily:
TheBullBear.com, TradingView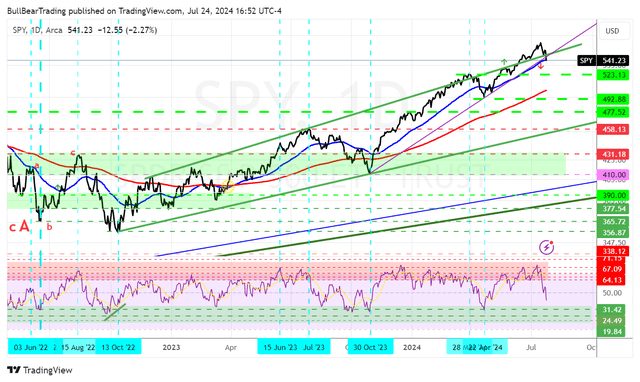
Here we see an expanding wedge pattern off the late 2022 low, with a recent breakout above the upper rail of the pattern as daily RSI got into its resistance zone. This was followed by a fail back into the pattern and a trend line break of the rally off the October 2023 low and a close below the 50-day exponential moving average. The failure of the breakout followed by the loss of key technical support is a classic technical setup for a larger decline.
QQQ daily:
TheBullBear.com, TradingView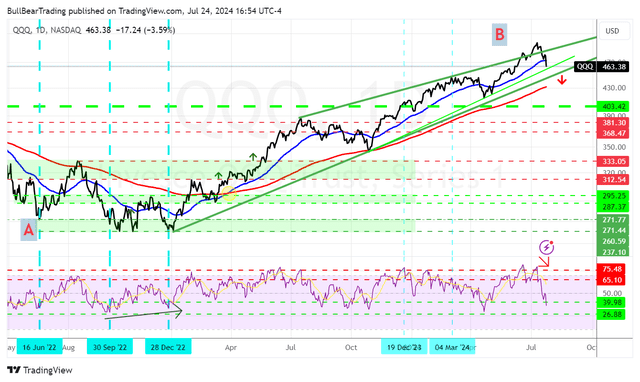
Similar upside breakout failure with the additional feature that the major uptrend from the December 2022 low is not far away and could be broken soon. The saving grace here is that on a daily basis, Relative Strength Index is already downside extended. So a bounce off that major green trend line, or the red 200-day EMA, is likely. This will give traders a chance to exit before a more substantive correction takes hold.
Now let’s look at the more important weekly charts.
SPY weekly:
TheBullBear.com, TradingView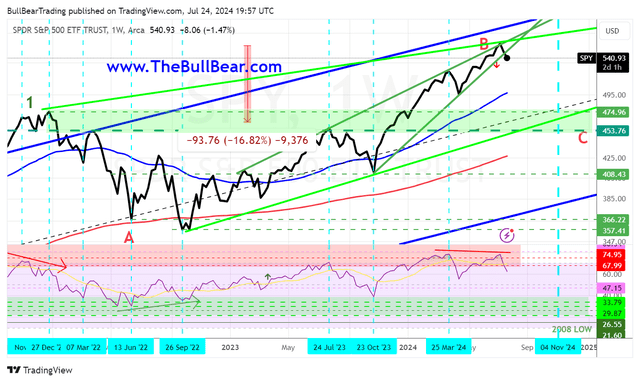
We can see a clear rising wedge (converging trend lines) with a bear RSI divergence, and then an upside breakout followed by a downside break of the pattern. Very reliably bearish technical action. What we are looking for here is a decline to price support accompanied by a technical reset of RSI down to its support zone. We see a clear zone of price and technical support comprised of the lower rail of the light green channel, a zone of prior highs and lows, and the red 200-week EMA. That looks to project to around November. So the scenario appears to be uncertainty and nervousness being resolved after the election just as the corrective movement is exhausting itself and finding technical support. This appears to project to a 17% decline from the high. A drop of 20% is usually given the “bear market” label, and once the financial news media is pumping that number and giving voice to the usual permabears, that should mark the bottom.
QQQ weekly:
TheBullBear.com, TradingView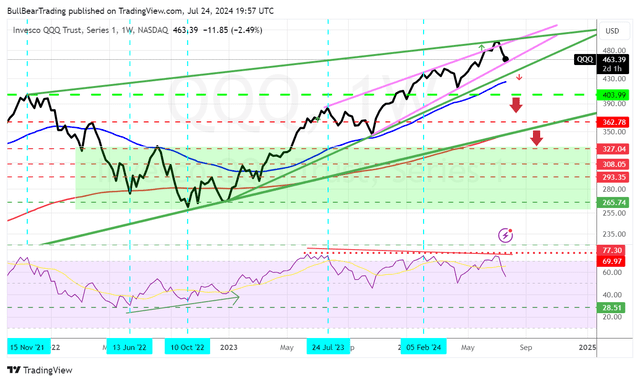
More or less the same setup. Note the pattern of bear divergences in weekly RSI. A touch of the green long-term trend line and the red 200-week EMA is going to be a great buying opportunity for technology stocks.
IWM weekly:
TheBullBear.com, TradingView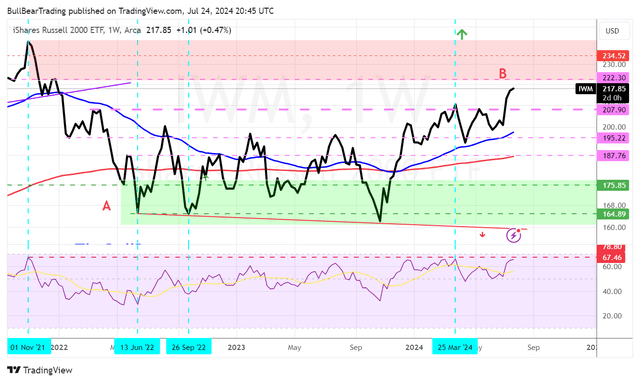
I’ve been very bearish on smaller issues for a while now. While I don’t expect to see lower lows for SPY and QQQ, I do expect to see much lower lows for small cap stocks. In fact, I think that the business models of many small cap issues will be completely disrupted by AI and robotics and this sector, which comprises many non-profitable “zombie” stocks that are heavily reliant on debt, will see the number of companies in the Russell 2000 index halved over the course of the next few years. Sell now.
Let’s check in on the long-term Dow monthly:
TheBullBear.com, TradingView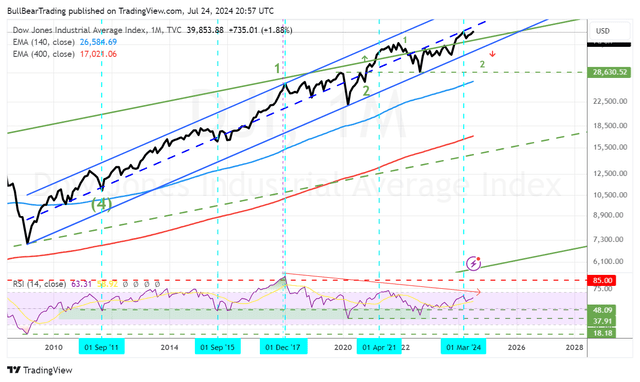
That upper green rail goes back to 1929. So in other words, over the last few years, the Dow has been playing around with the upper limits of its ultra long term trend channel. At the same time, it is in the lower half of its trend channel off the 2009 low. So this is a period in which the index is preparing to leave behind its very long-term trend with a break to the upside. I’m looking for a final dip back into the old channel and a retest of the lower support zone of monthly RSI. From there, the rally into the next phase of “the market” should begin.
Long-time followers know that I never refer to these financial mechanisms as “markets” since a market is a feature of a capitalist economy. We are already in post-capitalism, in an intermediate, transitional phase that I call “Debt Monetarism”. The numbers and the values represented here don’t reflect much more than the ability of large organizations to pull future value into the present and park it in their stock mechanisms through primarily psychological and bookkeeping gamesmanship. Recognizing the reality of the game doesn’t mean we shouldn’t play along and benefit from it, however. So as this correction takes hold and unfolds, follow me to keep up with its progress until we arrive at the anticipated long term buying opportunity.
Check out these other recent SA articles:
Bitcoin May Now Be Starting Its Next Bull Run To $100K And Beyond
Bitcoin: Bottoming Or Breaking?
Intelligence Economics: The Future Of Value Creation In The Era Of Technological Intelligence
Credit: Source link