
SimonSkafar
Saba Capital Management is an investment advisory firm focused on credit and equity relative value strategies.
Boaz Weinstein started Saba Capital in 2009 as a “lift out” from Deutsche Bank’s proprietary credit trading group. Boaz had originally formed the group at Deutsche Bank in 1998.
Pierre Weinstein, who is a Partner/portfolio manager at Saba at the launch and is primarily responsible for equity derivatives. He is not related to Boaz, even though they share the same last name.
Paul Kazarian joined the team in March 2013, and is responsible for exchange traded products, including ETF arbitrage and closed-end funds. Before coming to Saba, Paul was a Director at RBC Capital Management in the Global Arbitrage and Trading Group.
The four main strategies currently used by Saba Capital are:
1) Credit Relative Value: This is the original “flagship” strategy used by Saba Capital when it was first formed. They try to identify market dislocations across the whole capital structure using a long/short market neutral approach in both credit and equity markets. They combine quantitative models with in depth fundamental research and technical analysis.
2) Tail Hedge: This is a risk reduction strategy designed to provide a cost effective portfolio hedge during market periods when there is significant stress and dislocation. The primary vehicle used is credit default swaps or “CDS” on a portfolio of lower spread investment grade companies.
At times, Saba may also look for opportunities to buy CDS on indices and higher yielding companies, or to invest in equity puts. By using proprietary tools, their goal is to generate alpha compared to simple tail hedges that merely rely on passive indices.
3) Active Closed-End Fund Strategies
Saba takes an active role in managing their closed-end fund trades. Their main focus is on CEFs that trade at a significant discount to NAV. They look at CEFs around the world, not only in the US. The primary focus is on fixed income oriented CEFs that own high yield bonds and loans. One immediate edge they get here is that the distribution yield of the CEF is generally higher than the yield on the underlying fixed income instruments.
But Saba Capital is also a strong activist investor. They use various corporate actions as a tool to monetize the discount to NAV. For many CEFs, Saba Capital is the largest shareholder.
4) SPAC Strategies
Saba Capital has over 15 years experience in trading SPACs using a relative value approach. They try to generate high risk-adjusted returns, but with low risk. They primarily own SPACs before the business combination is consummated, since these issues have the protection of the underlying assets in the trust. But they also may use SPAC warrants and listed options to enhance returns.
======
Saba Capital runs an ETF with ticker (CEFS), that focuses mainly on their active closed-end fund strategies. CEFS is not the main focus of this article, which focuses on (NYSE:BRW) and (SABA) which are closed-end funds that are more like hedge funds, and tend to use all of Saba’s active strategies.
At one point in 2022, BRW had over 80% of the portfolio invested in the low risk SPAC arbitrage strategy. Check out my BRW article from June 2022.
Saba Capital is very opportunistic when managing their portfolios. At the current time, the BRW exposure to the SPAC arbitrage strategy is only 2% which is down from 80% a few years ago. They apparently feel there are better opportunities now in other asset classes.
CEF “Takeovers”
The two Saba CEFs I will be discussing in this article are BRW and SABA. In both cases, the funds were “taken over” by Saba Capital after significant activist investments in older funds.
1) BRW took over the Voya Prime Rate Trust (PPR) after an activist campaign back in June 2021. The fund strategy changed significantly from a senior loan fund to more of a hedge fund. These were the changes to the fund’s investment management agreement that were announced at the time:
|
· |
The removal of the Fund’s fundamental investment restriction relating to investing in warrants; |
|
· |
The removal of the Fund’s fundamental investment restriction relating to purchasing or selling equity securities, engaging in short-selling and the use of certain option arrangements; |
|
· |
The removal of the Fund’s fundamental investment restriction relating to investing in other investment companies; |
|
· |
Changing the Fund’s sub-classification under the Investment Company Act of 1940 from “diversified” to “non-diversified”; and |
|
· |
A change of the Fund’s investment objective and to make the investment objective non-fundamental. |
2) The new fund SABA was recently formed after taking over Templeton Global Income fund (GIM). The transition from GIM to SABA occurred on December 31, 2023. At that point, the SABA fund was 100% invested in cash to get ready for the transition. The fund objective was also changed to “non-fundamental” to provide the fund with greater flexibility. They removed the requirement that GIM had where at least 65% of total assets had to be invested in at least three countries in various debt instruments.
BRW: Saba Capital Income & Opportunities Fund
BRW is a closed-end fund run by Saba Capital. It currently trades at a 9.4% discount to NAV and has a market distribution yield of 14.13%. It gives you a way to invest in hedge fund style long-short strategies without having to pay incentive fees. But in return, the non-leveraged expense ratio is fairly high at 1.58%.
Distribution Policy
BRW uses a managed distribution plan. It pays monthly distributions at a fixed rate of 12% of the previous month’s average NAV divided by 12. The management instituted this policy to help reduce the discount to NAV. They have been partially successful, and the discount got as low as 6% at one point, but the discount has stubbornly remained a little under 10% for quite a while now.
BRW Portfolio: Changes From April 30, 2022 to January 31, 2024
BRW is an actively managed long/short hedge fund like fund. You can see this reviewing the changes in the portfolio between April 30, 2022, when I wrote my last article on BRW and the current portfolio. There has been a sharp reduction in the allocation to the SPAC arbitrage strategy, and much more emphasis on a long/short portfolio now. The negative numbers listed in the allocation table refer to short positions of that asset class.
As of Jan 31, 2024, the leverage used was $92.4 Million or 20.98% of AUM. The portfolio was widely diversified with 508 different issuers. The total Assets under Management was $440 Million.
BRW Portfolio Changes (Saba Fund Web Site)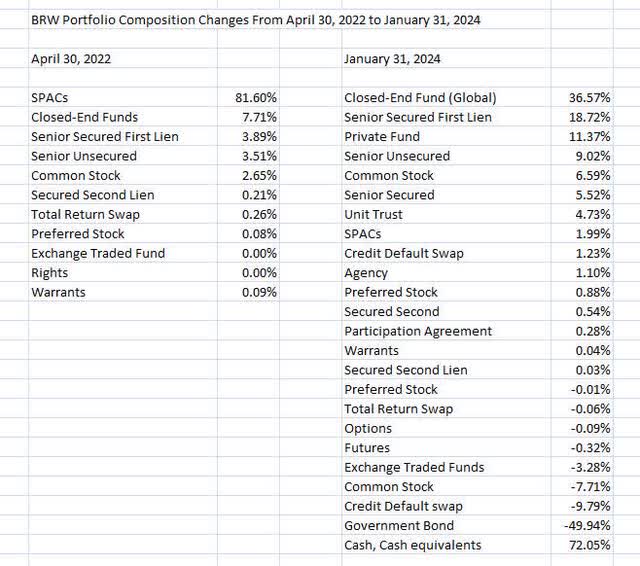
BRW- Three-Year Discount History
BRW 3 Year Discount History (cefconnect)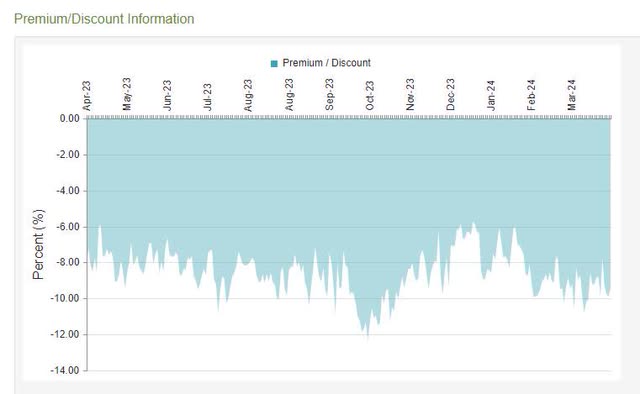
BRW-Top Ten Holdings
When we review the top ten holdings below, we see some eclectic issues. The Stone Ridge Opportunities Fund LP is the top holding. This is a description from their web site of the strategies they use:
“We focus on strategies that offer a risk premium that is persistent, pervasive, and intuitive – with low correlations to each other and low correlations to traditional asset classes. These support a concept that we call the 10/10 portfolio: 10 long-term allocations to uncorrelated investments that maximize diversification.”
Some of the nontraditional strategies they use include: Reinsurance, Multi-Strategy, Fixed or Inflation Adjusted Retirement Income, Post-War and Contemporary Art, Alternative Lending, Energy, Single-Family Rental, Bitcoin, Drug Royalties. Saba Capital apparently likes this partnership because they have also included it in their newer SABA fund.
Note that Saba also had a position in the Grayscale Ethereum Classic Trust (OTC:ETCG). This is an oddball crypto holding. Saba was likely attracted to the large discount to NAV and was hedging the exposure with a short position in a bitcoin ETF.
BRW Top Holdings (Saba Capital Web Site)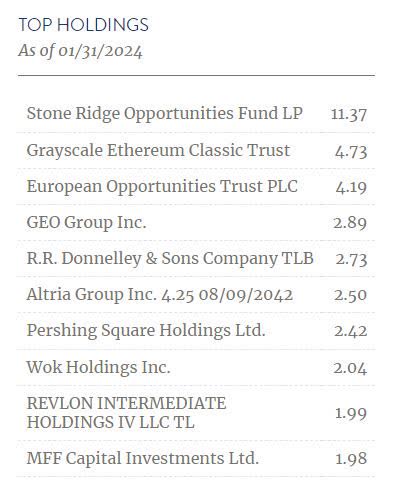
BRW- Sector and Country Weightings
BRW Sector Weightings (Saba Capital web site)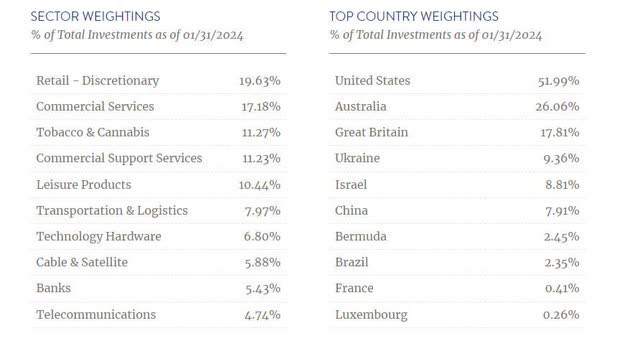
Saba Capital Income & Opportunities Fund
Ticker: BRW NAV Ticker: XBRWX
- Inception Date: May 12, 1998 (originally PPR)
- Total Investment Exposure: 392 Million
- Total Common Assets: 339 Million
- Effective Leverage: 13.5%
- Baseline Expense Ratio= 1.58%
- Discount= -9.22%
- Average 6 month discount= -8.75%
- 1 Year Z-Score= -0.69
- Annual Distribution Rate (market price) = 14.13%
- Current Monthly distribution= $0.085
- Annual Distribution= $1.02
============================================
SABA: Saba Capital Income & Opportunities Fund II
SABA is a new closed-end fund run by Saba Capital after the “takeover” of GIM. It currently trades at a 14.06% discount to NAV and has a market distribution yield of 9.33%. It gives you another way to invest in hedge fund style long-short strategies. SABA is about half the size of BRW, but has a lower non-leveraged expense ratio of 1.09%, which is about 50 basis points less than the expense ratio of BRW.
SABA- One-Year Discount History
Since SABA was completely remade starting on January 1, 2024, the most relevant portion of the discount history is the segment in 2024.
SABA Discount History (cefconnect)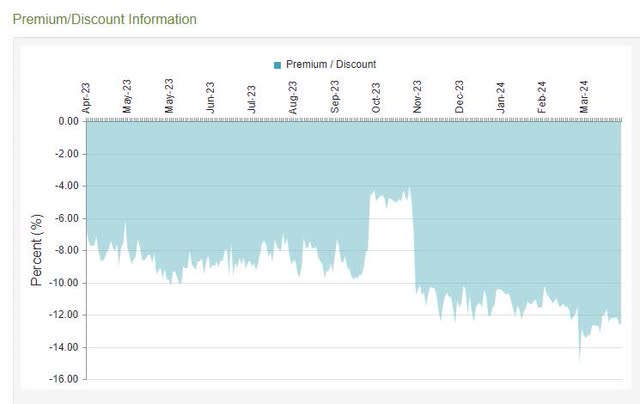
Distribution Policy
SABA does not use a formal managed distribution plan like BRW. But it has paid monthly distributions of $0.029 every month in 2024. The annualized distribution yield is currently around 9.33% which is somewhat lower than the 14.13% paid by BRW.
SABA Portfolio Composition (as of January 31, 2024)
As of the end of January, SABA was still working on putting the cash to work, and still had about 66.5% invested in cash. So far, the portfolio has some similarities to the BRW portfolio, because of the large allocation to the Stone Ridge Opportunities Fund LP. But there are also some big differences, since SABA has limited short positions.
SABA Portfolio Composition (Saba Capital Web site)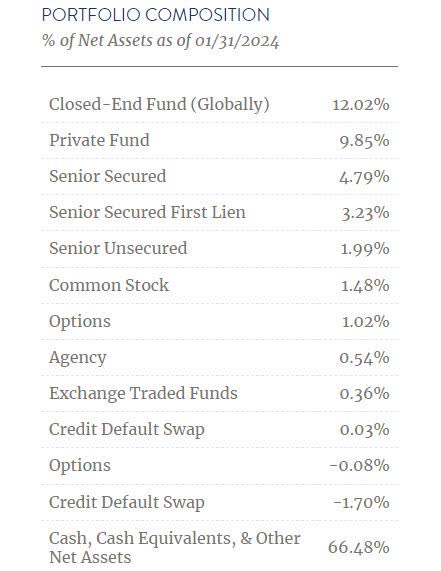
SABA- Top 10 Holdings
When comparing the top ten holdings of SABA with BRW, I see only two holdings in common- Stone Ridge Opportunities Fund LLP and Revlon Intermediate Holdings IV LLC TL. At least for now, the managers seem to be looking for the best new opportunities to deploy SABA’s cash and are not just replicating the BRW portfolio.
SABA Top 10 Holdings (Saba Capital web site)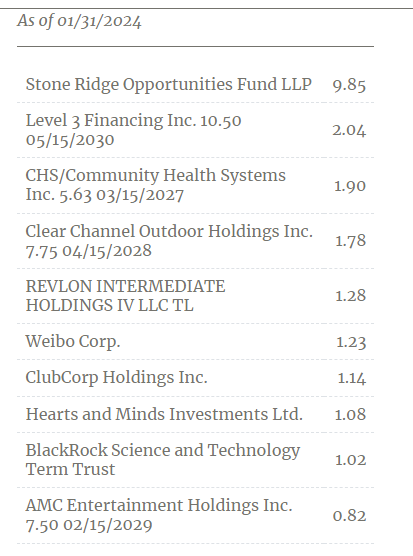
SABA- Sector and Country Weightings
SABA Sector Weightings (Saba Capital web site)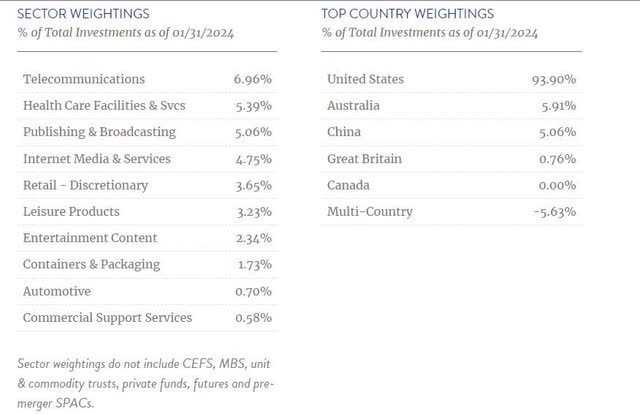
Saba Capital Income & Opportunities Fund II
Ticker: SABA NAV Ticker: XSABX
- Inception Date: March 17, 1988 (originally GIM)
- Total Investment Exposure: 245 Million
- Total Common Assets: 245 Million
- Effective Leverage: 0.00%
- Baseline Expense Ratio= 1.09%
- Discount= -12.59%
- Average 6 month discount= -10.58%
- 3 Month Z-Score= -2.14
- Annual Distribution Rate (market price) = 9.33%
- Current Monthly distribution= $0.029
- Annual Distribution= $0.348
Concluding Remarks
I think both BRW and SABA are interesting ways to get hedge fund-like exposure in a closed-end fund without paying incentive fees. You also get a decent discount for each fund.
BRW is about twice as big as SABA and has somewhat more trading activity:
BRW average daily trading volume= 220,000 Dollar Volume= $1.6 Million
SABA average daily trading volume= 266,000 Dollar Volume= $1.0 Million
At the current time, I favor SABA over BRW, because of its lower expense ratio and higher discount to NAV. Because of its higher cash balance earlier this year, you also get more exposure to Saba’s current “best” ideas. I also believe that at some point in the future, Saba Capital may want to merge SABA with BRW, so the higher discount now would give you a slight edge.
The only disadvantages I see to SABA is that there may be some additional trading expenses as the managers put the remaining cash to work, and the slightly lower trading liquidity.
Recently, Saba Capital seems to be taking an interest in non-US closed-end funds that trade in London and Australia. I think we may see more of these CEFs showing up in the SABA portfolio in their next shareholder report.
Credit: Source link